
Group #7: Colonial Club
David, John and Horia
Project Summary
We are making a system that helps users to maintain good posture while sitting.
Test Method
Obtaining informed consent
We obtained informed consent by providing a form for our test-users to form. Here is the link: https://dl.dropbox.com/u/8267147/Consent%20Form.doc
Selecting participants
Participants were selected based on how we felt they would fit with the target-user group. If we saw the person as someone who did not sit at a desk for extended hours, then we wouldn’t use them as a test user. The people we picked were generally people who were known to sit at desks for extended hours and enjoy using technology to improve their lives.
Testing Environment
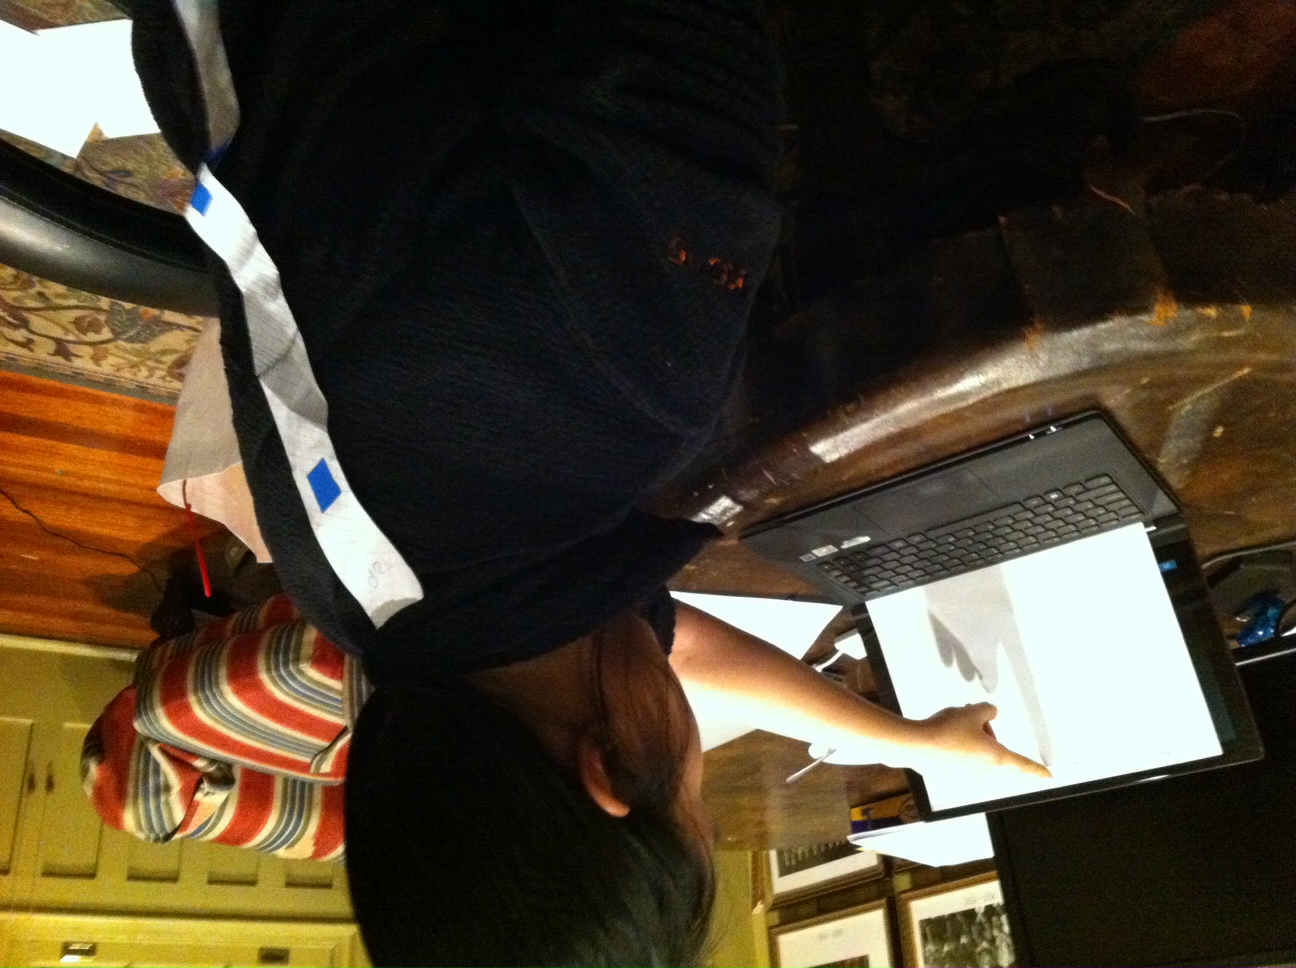
Our testing environment was set up essentially the same as described in P3. We had a desk with a computer and a desk chair with good back support. The paper prototype of the desktop application was placed on the screen. The paper prototype of the back device was placed on the user’s back.
Testing Procedure
- John greeted the test user and gained informed consent.
- David generally described the system and its purpose.
- David read the script to the demo while John acted out the demo.
- David read the task scripts while John gave functionality to the paper prototypes.
- John thanked the participant
- The group discussed the notes taken about the participant’s actions
Demo Script:
We are evaluating a system that makes users aware of bad posture during extended hours of sitting. We want our system to quickly alert people in the event that they have bad back posture so that they can avoid its associated negative long term effects.
Here is a short example of our prototype in use. The user first puts the prototype onto their back, taking note of the labeled top and bottom sections. The user then opens up the desktop application that interacts with the prototype. This application displays relevant back posture information and statistics to the user.
Task #1 Script
For the first task, you will be setting the desired back posture through the desktop application that you hope to maintain. This should be a healthy back posture.
Task #2 Script
For this task, you will deviate your back posture from your desired back posture. You will then respond to the feedback generated by the prototype to correct your back posture.
Task #3 Script
For this last task, you will look at how your back posture changed over time. Additionally, view how your posture has changed for each of the three specific regions of your back.


Results
We found that our users were generally well-capable of performing the first two tasks. However, one subject was confused when asked to set the default back posture, and was unsure whether to complete this task through the GUI or the device itself. In regards to the second task, all three subjects readjusted their posture back to its original position in response to the vibration feedback provided.
Our third task produced a great deal of critical problems, many of which were common throughout all three test trials. All three subjects felt that the graph needed information, including the units for time and posture deviance. They also found it difficult to differentiate between graphs and often missed the legend in the top left until the end of the experiment. One subject proposed using a diagram of the spine to display problematic areas when appropriate (i.e. glow red in areas where the user has poor posture.) Another user swiped their finger across the graph to see if any information would result; additionally, they tried right-clicking to bring up a menu / additional choices.
Discussion of Results
In future iterations, it may be beneficial to include more beginning-phase orientation, including explicit on-screen step-by-step instructions that guide the user through the putting on the device and setting the default posture. Having a diagram of the back can help easily demonstrate both the site and degree of poor posture, either in real time or as the user is scrubbing over the data with their cursor. Additionally, we learned that our graphs must become more readable, and could benefit from explicit units and differentiable, potentially color-coordinated, plots corresponding to each region of the back.
Subsequent Testing
Although our low-fidelity prototype made transparent several areas of improvement, we feel as though these issues are not pressing enough to justify an additional round of low-fidelity prototyping. These adjustments are relatively minor and are so easily implementable in code that an additional low-fidelity prototype may be redundant. Additionally, after considering the our timeline for both constructing and debugging the high-fidelity prototype, we unanimously agree that it should be our priority to begin this development as soon as possible, so that we may quickly test its usability.