A little drop will do it: Tiny grains of lithium can dramatically improve the performance of fusion plasmas (Nuclear Fusion)

Fusion reaction image
Left: DIII-D tokamak. Right: Cross-section of plasma in which lithium has turned the emitted light green. (Credits: Left, General Atomics / Right, Steve Allen, Lawrence Livermore National Laboratory)

By Raphael Rosen, Princeton Plasma Physics Laboratory

Scientists from General Atomics and the U.S. Department of Energy’s (DOE) Princeton Plasma Physics Laboratory (PPPL) have discovered a phenomenon that helps them to improve fusion plasmas, a finding that may quicken the development of fusion energy. Together with a team of researchers from across the United States, the scientists found that when they injected tiny grains of lithium into a plasma undergoing a particular kind of turbulence then, under the right conditions, the temperature and pressure rose dramatically. High heat and pressure are crucial to fusion, a process in which atomic nuclei – or ions – smash together and release energy — making even a brief rise in pressure of great importance for the development of fusion energy.

“These findings might be a step towards creating our ultimate goal of steady-state fusion, which would last not just for milliseconds, but indefinitely,” said Tom Osborne, a physicist at General Atomics and lead author of the paper. This work was supported by the DOE Office of Science.

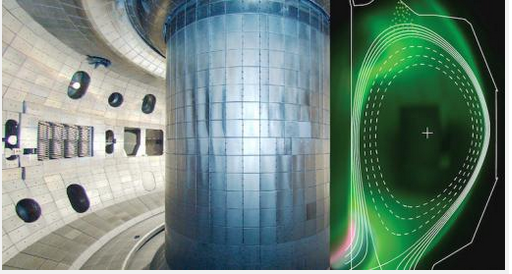
The scientists used a device developed at PPPL to inject grains of lithium measuring some 45 millionths of a meter in diameter into a plasma in the DIII-D National Fusion Facility – or tokamak – that General Atomics operates for DOE in San Diego. When the lithium was injected while the plasma was relatively calm, the plasma remained basically unaltered. Yet as reported this month in a paper in Nuclear Fusion, when the plasma was undergoing a kind of turbulence known as a “bursty chirping mode,” the injection of lithium doubled the pressure at the outer edge of the plasma. In addition, the length of time that the plasma remained at high pressure rose by more than a factor of 10.

Experiments have sustained this enhanced state for up to one-third of a second. A key scientific objective will be to extend this enhanced performance for the full duration of a plasma discharge.

Physicists have long known that adding lithium to a fusion plasma increases its performance. The new findings surprised researchers, however, since the small amount of lithium raised the plasma’s temperature and pressure more than had been expected.

These results “could represent the birth of a new tool for influencing or perhaps controlling tokamak edge physics,” said Dennis Mansfield, a physicist at PPPL and a coauthor of the paper who helped develop the injection device called a “lithium dropper.” Also working on the experiments were researchers from Lawrence Livermore National Laboratory, Oak Ridge National Laboratory, the University of Wisconsin-Madison and the University of California-San Diego.

Conditions at the edge of the plasma have a profound effect on the superhot core of the plasma where fusion reactions take place. Increasing pressure at the edge region raises the pressure of the plasma as a whole. And the greater the plasma pressure, the more suitable conditions are for fusion reactions. “Making small changes at the plasma’s edge lets us increase the pressure further within the plasma,” said Rajesh Maingi, manager of edge physics and plasma-facing components at PPPL and a coauthor of the paper.

Further experiments will test whether the lithium’s interaction with the bursty chirping modes — so-called because the turbulence occurs in pulses and involves sudden changes in pitch — caused the unexpectedly strong overall effect.

PPPL, on Princeton University’s Forrestal Campus in Plainsboro, N.J., is devoted to creating new knowledge about the physics of plasmas — ultra-hot, charged gases — and to developing practical solutions for the creation of fusion energy. Results of PPPL research have ranged from a portable nuclear materials detector for anti-terrorist use to universally employed computer codes for analyzing and predicting the outcome of fusion experiments. The Laboratory is managed by the University for the U.S. Department of Energy’s Office of Science, which is the largest single supporter of basic research in the physical sciences in the United States, and is working to address some of the most pressing challenges of our time. For more information, please visit science.energy.gov.

Read the abstract

T.H. Osborne, G.L. Jackson, Z. Yan, R. Maingi, D.K. Mansfield, B.A. Grierson, C.B. Chrobak, A.G. McLean, S.L. Allen, D.J. Battaglia, A.R. Briesemeister, M.E. Fenstermacher, G.R. McKee, P.B. Snyder and The DIII-D Team. “Enhanced H-mode pedestals with lithium injection in DIII-D.” Nuclear Fusion. Published May 8, 2015. DOI:10.1088/0029-5515/55/6/063018


Reshaping mountains in the human mind to save species facing climate change (Nature Climate Change)

2015_05_18_Himalaya_ElsenBy Morgan Kelly, Office of Communications

People commonly perceive mountain ranges as jumbles of pyramid-shaped masses that steadily narrow as they slope upward.

While that’s certainly how they appear from a ground-level human viewpoint, a new study shows that pyramid-shaped mountains are not only a minority in nature, but also that most ranges actually increase in area at higher elevations. Besides reshaping the mountains in our mind’s eye, the findings could lead scientists to reconsider conservation strategies — which are often based on misconceptions about mountain terrain — for mountain animal species threatened by climate change.

Researchers at Princeton University and the University of Connecticut conducted the first study to map the shape of the world’s major mountain ranges and found that the classic triangular form in which land-area uniformly decreases as elevation increases only applies to roughly one-third of the world’s mountain ranges, according to a report in the journal Nature Climate Change.

Instead, the 182 mountain ranges the researchers studied take on four principal shapes: diamond, pyramid, inverted pyramid and hourglass. The researchers analyzed high-resolution topography maps for every mountain range to determine land area by elevation. They found that for all the range shapes except pyramid, land availability can be greater at higher elevations than it is farther down the mountainside.

The researchers found that the 182 mountain ranges they studied have four principal shapes. Diamond-shaped ranges such as the Rocky Mountains (a) increase in land area from the bottom until mid-elevation before contracting quickly. Pyramid-shaped mountains such as the Alps (b) have sides that rise sharply and consistently decrease in area the higher they go. The Kunlun Mountains (c) of China take the form of inverse pyramids, which gradually expand in area as elevation increases before suddenly widening toward their peaks. For hourglass-shaped mountain ranges such as the Himalayas (d), land area rises slightly then decreases at mid-elevations before increasing sharply at higher elevations. The three-dimensional images (second row) represent each range shape as viewed from the side. Moving from bottom to top, the width of the shape changes to represent an increase or decrease in area at a specific elevation. Elevation spans from zero to more than 8,685 meters (28,494 feet), and is denoted by the color scale from blue (lowest elevation) to brown (highest elevation). (Image by Paul Elsen, Princeton University Department of Ecology and Evolutionary Biology; Morgan Tingley, University of Connecticut; and Mike Costelloe)

Yet, people’s idea that land area steadily shrinks as a mountain rises is so entrenched that it has come to guide conservation plans and research related to climate change, said first author Paul Elsen, a Princeton graduate student of ecology and evolutionary biology. Scientists project that as mountain species move to higher elevations to escape rising global temperatures they will face a consistent loss of territory — as well as an increase in resource competition — that all but ensures their eventual extinction.

While this risk exists in pyramid-shaped ranges, many species in other range types might in fact benefit from seeking higher altitudes if they move to an elevation with more land area than the one they left, Elsen said. The researchers’ results could be used to more precisely identify those elevation zones where species will encounter territory losses and potentially become more threatened as they move upward, he said. The limited resources that exist for conservation could then be targeted to those species.

“This work should completely change the way we see mountains,” Elsen said. “No one has looked at the shapes of mountain ranges across the entire globe, and I don’t think anyone would expect that only 30 percent of the ranges in the world have this pyramid shape that we have assumed is the dominant shape of mountains.

“That has been the prevailing image of mountains in the public perception and the scientific perception, and it’s really had a big influence on how scientists think mountain species will respond to climate change,” he said.

This slideshow requires JavaScript.

The researchers are the first to measure available area by elevation — known as the hypsographic curve — at the scale at which animals actually live, said co-author Morgan Tingley, a University of Connecticut assistant professor of ecology and evolutionary biology and a past postdoctoral research associate in the Program in Science, Technology and Environmental Policy in Princeton’s Woodrow Wilson School of Public and International Affairs.

“People have explored the global pattern wherein you take all the surface area on the Earth and look at availability versus elevation. If you do that, then you do get a nice pyramidal pattern for all mountain ranges because there are so many low-elevation non-mountainous parts of the world,” Tingley said.

“But that’s not a relevant scale for species or conservation. There is no globally distributed mountain species,” he said. “At the spatial scales at which species live, the majority of mountain regions are not pyramids.”

Map
The researchers examined ranges on every continent except Antarctica and found that the pyramid form in which land-area uniformly decreases as elevation increases only applies to roughly one-third of the world’s mountain ranges. A majority, or 39 percent, of the ranges they studied are diamond-shaped (red), whereas pyramid-shaped mountains (green) constitute only 32 percent. The hourglass shape (blue) characterizes 23 percent of ranges, and only 6 percent of ranges take the form of an inverse pyramid (purple).(Image by Paul Elsen, Princeton University Department of Ecology and Evolutionary Biology, and Morgan Tingley, University of Connecticut)

Elsen and Tingley examined ranges on every continent except Antarctica spanning altitudes from zero to more than 8,500 meters (27,887 feet), which is the approximate maximum height of the Himalayas. A majority of the ranges they studied (39 percent) such as the Rocky Mountains are diamond-shaped, meaning that land-area increases from the bottom until the mid-elevation range before contracting quickly.

Hourglass-shaped mountain ranges such as the Himalayas make up 23 percent of ranges. Land area in these types rises slightly then decreases at mid-elevations before increasing sharply at higher elevations.

The nearby Kunlun Mountains of China are representative of the 6 percent of ranges worldwide that take the form of inverse pyramids, which gradually expand in area as elevation increases before, like the hourglass ranges, suddenly widening toward their peaks.

A mainstay of the human mind, pyramid-shaped mountains such as the Alps constitute only 32 percent of the mountain ranges that Elsen and Tingley studied. These mountains have sides that rise sharply and consistently decrease in area the higher they go.

On the other hand, the other range shapes are formed by a series of slopes that rise to open, wide plateaus situated at the base of yet more slopes, Elsen said. These mountains are akin to scaling a giant table where a leg represents a steep, limited-area climb that leads to a high-altitude expanse, he said.

“We expected some interesting exceptions to the pyramid shape – it turned out that pyramids are by far the exception. It’s something that twists your mind around,” Elsen said. “I really encourage people trying to grasp this for the first time to take less of a two-dimensional perspective of looking from the side and picture the range from above — a mountain range is a very three-dimensional system.”

The researchers point out that animals that could benefit from an increase in elevation may still face other threats — habitat loss, food availability and exposure to existing animals and diseases, for instance. Even the range shapes themselves provide unique areas of concern — hourglass-shaped ranges such as the Himalayas, for instance, present a “bottleneck” at mid-elevation that could become overwhelmed with species moving upslope from more expansive lower elevations.

“Not every elevation holds equal value for conservation,” Tingley said. Our research suggests that some gradients, and some portions of gradients, will be more important than others. Protecting land within an elevational bottleneck, for example, will be critical. That is where species will be greatly pressured, and often long before they reach the mountaintop.”

Read the abstract.

Paul R. Elsen and Morgan W. Tingley. 2015. Global mountain topography and the fate of montane species under climate change. Nature Climate Change. Article published online May 18, 2015. DOI: 10.1038/nclimate2656.

The work was supported by Princeton University, the National Science Foundation Graduate Research Fellowship Program (grant no. DGE-1148900), and the D.H. Smith Conservation Research Fellowship administered by the Society for Conservation Biology and financially supported by the Cedar Tree Foundation.

Solving streptide from structure to biosynthesis (Nature Chemistry)

Streptide (Image source: Seyedsayamdost Lab)
(Image source: Seyedsayamdost Lab)

By: Tien Nguyen

Bacteria speak to one another using peptide signals in a soundless language known as quorum sensing. In a step towards translating bacterial communications, researchers at Princeton University have revealed the structure and biosynthesis of streptide, a peptide involved in the quorum sensing system common to many streptococci.

Leah Bushin, Class of 2014

“It’s extremely rare for one research group to do both natural products discovery and mechanistic enzymology,” said Leah Bushin, a member of the Seyedsayamdost lab and co-first author on the article published on April 20 in Nature Chemistry. Bushin worked on elucidating the structure of streptide as part of her undergraduate senior thesis project and will enter Princeton Chemistry’s graduate program in the fall.

To explore how bacteria communicate, first she had to grow them, a challenging process in which oxygen had to be rigorously excluded. Next she isolated the streptide and analyzed it using two-dimensional (2D) nuclear magnetic resonance (NMR) spectroscopy, a technique that allows scientists to deduce the connections between atoms in a molecule by pulsing their nuclei with powerful magnets to pulse atomic nuclei.

The experiments revealed that streptide contained an unprecedented crosslink between two unactivated carbons on lysine and tryptophan, constituting a new class of macrocyclic peptides. “We didn’t think it would be as cool as a carbon-carbon bond between two amino acid side chains, so it was definitely a surprise.” said Bushin.

To figure out how this novel bond was being formed, the researchers took a closer look at the gene cluster that produced streptide. Within the gene cluster, they suspected a radical S-adenosyl methionine (SAM) enzyme, which they dubbed StrB, could be responsible for this unusual modification.

Kelsey Schramma
Kelsey Schramma, a graduate student in the Seyedsayamdost lab

“Radical SAM enzymes catalyze absolutely amazing chemistries,” said Kelsey Schramma, a graduate student in the Seyedsayamdost lab and co-first author on the article. “There are over 48,000 radical SAM enzymes, but only about 50 have been characterized and just a dozen or so studied in detail,” she said.

To probe the enzyme’s role in making streptide, the researchers created a mutated version of the bacteria lacking the strB gene. The mutant failed to produce streptide, confirming that the StrB enzyme was significant and warranted further study.

Schramma determined that in order to function properly, the StrB enzyme required some key components: the pre-crosslinked substrate, which she prepared synthetically, cofactor SAM, reductant, and two iron-sulfur (Fe-S) clusters carefully assembled in the protein interior. The team then showed that one of the FeS clusters reductively activated one molecule of SAM, kicking off a chain of one-electron (radical) reactions that gave rise to the novel carbon-carbon bond.

“The synergy between Leah and Kelsey was great,” said Mohammad Seyedsayamdost, an assistant professor of chemistry at Princeton who led the research team. “They expressed interest in complementary aspects of the project and the whole ended up being greater than the sum of its parts,” he said.

Their efforts included not only chemical and biological approaches, but also theoretical computational studies. While the 2D NMR experiments revealed the flat structure of streptide, its three-dimensional conformation was still unknown.

“Since the crosslink had never been reported, we had to code the modification into the program, which took a bit of creativity,” Bushin said. After corresponding with the software creator, they were able to confidently assign a key residue in the macrocycle with the S-configuration.

Future work will target streptide’s biological function—its meaning in the bacterial language—as well as confirming its production by other streptococcal bacteria strains.

“What we have revealed is a new and unusual mechanism that nature uses to synthesize macrocyclic peptides. There is a lot of novel chemistry to be discovered by interrogating bacterial secondary metabolite biosynthetic pathways,” Seyedsayamdost said.

Read the article here:

Schramma, K. R.; Bushin, L. B.; Seyedsayamdost, M. R. “Structure and biosynthesis of a macrocyclic peptide containing an unprecedented lysine-to-tryptophan crosslink.Nature Chemistry, 2015, 7, 431.

This work was supported by the National Institutes of Health (grant no. GM098299), and by Princeton University start-up funds.

New research will help forecast bad ozone days over the western U.S. (Nature Communications)

The contribution of stratospheric ozone to US surface ozone peaks in the western Rockies during late spring. This map shows mean contribution in parts per billion by volume (ppbv) for May to June. Credit: NOAA

New research published in Nature Communications led by Meiyun Lin of NOAA’s Geophysical Fluid Dynamics Laboratory and NOAA’s cooperative institute at Princeton University, reveals a strong connection between high ozone days in the western U.S. during late spring and La Niña, an ocean-atmosphere phenomena that affects global weather patterns.

Recognizing this link offers an opportunity to forecast ozone several months in advance, which could improve public education to reduce health effects. It would also help western U.S. air quality managers prepare to track these events, which can have implications for attaining the national ozone standard.

Exposure to ozone is harmful to human health, can cause breathing difficulty, coughing, scratchy and sore throats, and asthma attacks, and can damage sensitive plants.

NOAA scientists used a lidar aboard this Twin Otter aircraft to study the movement of ozone from the stratosphere to the lower atmosphere above California in 2010. Credit: NOAA

“Ozone in the stratosphere, located 6 to 30 miles (10 to 48 kilometers) above the ground, typically stays in the stratosphere,” said Lin, an associate research scholar in the Program in Atmospheric and Oceanic Sciences at Princeton University. “But not on some days in late spring following a strong La Niña winter. That’s when the polar jet stream meanders southward over the western U.S. and facilitates intrusions of stratospheric ozone to ground level where people live.”

Over the last two decades, there have been three La Niña events – 1998-1999, 2007-2008 and 2010-2011. After these events, scientists saw spikes in ground level ozone for periods of two to three days at a time during late spring in high altitude locations of the U.S. West.

While high ozone typically occurs on muggy summer days when pollution from cars and power plants fuels the formation of regional ozone pollution, high-altitude regions of the U.S. West sometimes have a different source of high ozone levels in late spring. On these days, strong gusts of cold dry air associated with downward transport of ozone from the stratosphere pose a risk to these communities.

Lin and her colleagues found that these deep intrusions of stratospheric ozone could add 20 to 40 parts per billion of ozone to the ground-level ozone concentration, which can provide over half the ozone needed to exceed the standard set by the U.S. Environmental Protection Agency. The EPA has proposed tightening that standard currently set at 75 parts per billion for an eight-hour average to between 65 and 70 parts per billion.

In the spring after La Niña winters, when the polar jet stream meanders southward over the western US, it facilitates intrusions of stratospheric ozone to ground level where people live. Credit: NOAA

Under the Clean Air Act, these deep stratospheric ozone intrusions can be classified as “exceptional events” that are not counted towards EPA attainment determinations. As our national ozone standard becomes more stringent, the relative importance of these stratospheric intrusions grows, leaving less room for human-caused emissions to contribute to ozone pollution prior to exceeding the level set by the U.S. EPA.

“Regardless of whether these events count towards non-attainment, people are living in these regions and the possibility of predicting a high-ozone season might allow for public education to minimize adverse health effects,” said Arlene Fiore, an atmospheric scientist at Columbia University and a co-author of the research.

Predicting where and when stratospheric ozone intrusions may occur would also provide time to deploy air sensors to obtain evidence as to how much of ground-level ozone can be attributed to these naturally occurring intrusions and how much is due to human-caused emissions.

The study involved collaboration across two NOAA laboratories, NOAA’s cooperative institutes at Princeton and the University of Colorado Boulder, and scientists at partner institutions in the U.S., Canada and Austria. It was also supported in part by the NASA Air Quality Applied Sciences Team whose mission is to apply earth science data to help address air quality management needs.

“This study brings together observations and chemistry-climate modeling to help understand the processes that contribute to springtime high-ozone events in the western U.S.,” said Andrew Langford, an atmospheric scientist at NOAA’s Earth System Research Laboratory in Boulder, Colorado, whose teams measure ozone concentrations using lidar and balloon-borne sensors.

“You’ve heard about good ozone, the kind found high in the stratosphere that protects the earth from harmful ultraviolet radiation,” said Langford. “And you’ve heard about bad ozone at ground level. This study looks at the factors that cause good ozone to go bad.”

Lin, Fiore and Langford conducted the research with Larry Horowitz of NOAA’s Geophysical Fluid Dynamics Laboratory; Samuel Oltmans of the Cooperative Institute for Research in Environmental Sciences at the University of Colorado Boulder, who works in NOAA’s Earth System Research Laboratory; David Tarasick of Environment Canada; and Harald Rieder of the University of Graz in Austria.

Read the article in Nature Communications.

Citation:

Meiyun Lin, Arlene M. Fiore, Larry W. Horowitz, Andrew O. Langford, Samuel J. Oltmans, David Tarasick & Harald E. Rieder. Climate variability modulates western US ozone air quality in spring via deep stratospheric intrusions. Nature Communications 6, No 7105 doi:10.1038/ncomms8105

Courtesy of National Oceanic and Atmospheric Administration (NOAA) Communications & External Affairs

Dissecting the ocean’s unseen waves to learn where the heat, energy and nutrients go (Nature)

By Morgan Kelly, Office of Communications

Sonya Legg, Senior Research Oceanographer, Atmospheric and Oceanic Sciences at Princeton University, and a team of colleagues from other institutions created the first-ever model of the world’s most powerful internal ocean waves.
Sonya Legg, a senior research oceanographer in the Program in Atmospheric and Oceanic Sciences at Princeton University, and colleagues from collaborating institutions created the first “cradle to grave” model of the world’s most powerful internal ocean waves.

Beyond the pounding surf loved by novelists and beachgoers alike, the ocean contains rolling internal waves beneath the surface that displace massive amounts of water and push heat and vital nutrients up from the deep ocean.

Internal waves have long been recognized as essential components of the ocean’s nutrient cycle, and key to how oceans will store and distribute additional heat brought on by global warming. Yet, scientists have not until now had a thorough understanding of how internal waves start, move and dissipate.

Researchers from the Office of Naval Research’s multi-institutional Internal Waves In Straits Experiment (IWISE) have published in the journal Nature the first “cradle-to-grave” model of the world’s most powerful internal waves. Caused by the tide, the waves move through the Luzon Strait between southern Taiwan and the Philippine island of Luzon that connects the Pacific Ocean to the South China Sea.

Simulation of waves in Luzon Strait
The complexity of the Luzon Strait’s two-ridge system was not previously known. The Princeton researchers’ simulations showed that the two ridges of the Luzon Strait greatly amplify the size and energy of the wave, well beyond the sum of what the two ridges would generate separately. The simulation above of the tide moving over the second, or western, ridge shows that the tidally-driven flow reaches a high velocity (top) as it moves down the slope (left to right), creating a large wave in density (black lines) with concentrated turbulent energy dissipation (bottom). As the tide moves back over the ridge, the turbulence is swept away. For both the velocity and energy dissipation panels, the color scale indicates the greatest velocity or energy (red) to the least amount (blue). (Image by Maarten Buijsman, University of Southern Mississippi)

Combining computer models constructed largely by Princeton University researchers with on-ship observations, the researchers determined the movement and energy of the waves from their origin on a double-ridge between Taiwan and the Philippines to when they fade off the coast of China. Known to provide nutrients for whales and pose a hazard to shipping, the Luzon Strait internal waves move west at speeds as fast as 3 meters (18 feet) per second and can be as much as 500 meters (1,640 feet) from trough to crest, the researchers found.

The Luzon Strait internal waves provide an ideal archetype for understanding internal waves, explained co-author Sonya Legg, a Princeton senior research oceanographer in the Program in Atmospheric and Oceanic Sciences and a lecturer in geosciences. The distance from the Luzon Strait to China is relatively short — compared to perhaps the Hawaiian internal wave that crosses the Pacific to Oregon — and the South China Sea is relatively free of obstructions such as islands, crosscurrents and eddies, Legg said. Not only did these factors make the waves much more manageable to model and study in the field, but also resulted in a clearer understanding of wave dynamics that can be used to understand internal waves elsewhere in the ocean, she said.

Model of internal waves
Researchers from the Office of Naval Research’s multi-institutional Internal Waves In Straits Experiment (IWISE) — including from Princeton University — have published the first “cradle-to-grave” model of internal waves, which are subsurface ocean displacements recognized as essential to the distribution of nutrients and heat. The researchers modeled the internal waves that move through the Luzon Strait between southern Taiwan and the Philippine island of Luzon. Part of the Princeton researchers’ role was to simulate when and where the Luzon Strait’s internal waves are strongest as the tide moves westward from the Pacific Ocean into the South China Sea over a unique double-ridge formation in the strait. The above image shows the two underwater ridges — indicated in green, orange and red — between Taiwan (top) and island of Luzon (bottom). The color scale indicates elevation from lowest (blue) to highest (red). (Image by Maarten Buijsman, University of Southern Mississippi)

“We know there are these waves in other parts of the ocean, but they’re hard to look at because there are other things in the way,” Legg said. “The Luzon Strait waves are in a mini-basin, so instead of the whole Pacific to focus on, we had this small sea — it’s much more manageable. It’s a place you can think of as a laboratory in the ocean that’s much simpler than other parts of the ocean.”

Legg and co-author Maarten Buijsman, who worked on the project while a postdoctoral researcher at Princeton and is now an assistant professor of physical oceanography at the University of Southern Mississippi, created computer simulations of the Luzon Strait waves that the researchers in the South China Sea used to determine the best locations to gather data.

For instance, Legg and Buijsman used their models to pinpoint where and when the waves begin with the most energy as the ocean tide crosses westward over the strait’s two underwater ridges. Notably, their models showed that the two ridges greatly amplify the size and energy of the wave, well beyond the sum of what the two ridges would generate separately. The complexity of a two-ridge system was not previously known, Legg said.

The energy coming off the strait’s two ridges steepens as it moves toward China, evolving from a rolling wavelength to a steep “saw-tooth” pattern, Legg said. These are the kind of data the researchers sought to gather — where the energy behind internal waves goes and how it changes on its way. How an internal wave’s energy is dissipated determines the amount of heat and nutrients that are transferred from the cold depths of the lower ocean to the warm surface waters, or vice versa.

Models used to project conditions on an Earth warmed by climate change especially need to consider how the ocean will move excess heat around, Legg said. Heat that stays at the surface will ultimately result in greater sea-level rise as warmer water expands more readily as it heats up. The cold water of the deep, however, expands less for the same input of heat and has a greater capacity to store warm water. If heat goes to the deep ocean, that could greatly increase how much heat the oceans can absorb, Legg said.

As researchers learn more about internal waves such as those in the Luzon Strait, climate models can be tested against what becomes known about ocean mechanics to more accurately project conditions on a warmer Earth, she said.

“Ultimately, we want to know what effect the transportation and storage of heat has on the ocean. Internal waves are a significant piece in the puzzle in telling us where heat is stored,” Legg said. “We have in the Luzon Strait an oceanic laboratory where we can test our theoretical models and simulations to see them play out on a small scale.”

This work supported by the U.S. Office of Naval Research and the Taiwan National Science Council.

Read the abstract

Matthew H. Alford, et al. 2015. The formation and fate of internal waves in the South China Sea. Nature. Arti­cle pub­lished online in-advance-of-print May 7, 2015. DOI: 10.1038/nature14399