After extreme drought, forests take years to rebuild CO2 storage capacity (Science)

Drought image, provided by William AndereggBy Joe Rojas-Burke, University of Utah, and Morgan Kelly, Princeton University

In the virtual world of climate modeling, forests and other vegetation are assumed to quickly bounce back from extreme drought and resume their integral role in removing carbon dioxide from Earth’s atmosphere. Unfortunately, that assumption may be far off the mark, according to a new Princeton University-based study published in the journal Science.

An analysis of drought impacts at forest sites worldwide found that living trees took an average of two to four years to recover and resume normal growth rates — and thus carbon-dioxide absorption — after a drought ended, the researchers report. Forests help mitigate human-induced climate change by removing massive amounts of carbon-dioxide emissions from the atmosphere and incorporating the carbon into woody tissues.

The finding that drought stress sets back tree growth for years suggests that Earth’s forests are capable of storing less carbon than climate models have calculated, said lead author William Anderegg, a visiting associate research scholar in the Princeton Environmental Institute.

“This really matters because future droughts are expected to increase in frequency and severity due to climate change,” said Anderegg, who will start as an assistant professor of biology at the University of Utah in Aug. 2016. “Some forests could be in a race to recover before the next drought strikes. If forests are not as good at taking up carbon dioxide, this means climate change could speed up.”

Anderegg and colleagues measured the recovery of tree-stem growth after severe droughts at more than 1,300 forest sites around the world using records kept since 1948 by the International Tree Ring Data Bank. Tree rings provide a history of wood growth as well as carbon uptake from the surrounding ecosystem. They found that a few forests exhibited growth that was higher than predicted after drought, most prominently in parts of California and the Mediterranean.

In the majority of the world’s forests, however, trunk growth took two to four years on average to return to normal. Growth was about 9 percent slower than expected during the first year of recovery, and remained 5 percent slower in the second year. Long-lasting effects of drought were most prevalent in dry ecosystems, and among pines and tree species with low hydraulic safety margins, meaning these trees tend to keep using water at a high rate even as drought progresses, Anderegg said.

How drought causes such long-lasting harm remains unknown, but the researchers offered three possible answers: Loss of foliage and carbohydrate reserves during drought may impair growth in subsequent years; pests and diseases may accumulate in drought-stressed trees; or lasting damage to vascular tissues could impair water transport.

The researchers calculated that if a forest experiences a delayed recovery from drought, the carbon-storage capacity in semi-arid ecosystems alone would drop by about 1.6 metric gigatons over a century — an amount equal to about 25 percent of the total energy-related carbon emissions produced by the United States in a year. Yet, current climate models do not account for this massive carbon remnant of drought, Anderegg said.

“In most of our current models of ecosystems and climate, drought effects on forests switch on and off like a light,” Anderegg said. “When drought conditions go away, the models assume a forest’s recovery is complete and close to immediate. That’s not how the real world works.”

Droughts that include high temperatures—as opposed to only low precipitation—are a documented scourge to tree growth and health, Anderegg said. During the 2000-2003 drought in the American Southwest, for instance, the decrease in precipitation was comparable to earlier droughts, but the temperature was hotter than the long-term average by 3 to 6 degrees Fahrenheit.

“The higher temperatures really seemed to make the drought lethal to vegetation where previous droughts with the same rainfall deficit weren’t,” Anderegg said.

“Drought, especially the type that matters to forests, is about the balance between precipitation and evaporation, and evaporation is very strongly linked to temperature,” he said. “The fact that temperatures are going up suggests quite strongly that the western regions of the United States are going to have more frequent and more severe droughts, which would substantially reduce forests’ ability to pull carbon from the atmosphere.”

Anderegg co-authored the study with Princeton colleagues Stephen Pacala, the Frederick D. Petrie Professor in Ecology and Evolutionary Biology; Adam Wolf, an associate research scholar in ecology and evolutionary biology; and Elena Shevliakova, a senior climate modeler in ecology and evolutionary biology and in the National Oceanic and Atmospheric Administration’s (NOAA) Geophysical Fluid Dynamics Laboratory (GFDL) located on Princeton’s Forrestal Campus.

The research also included collaborators from Northern Arizona University, University of Nevada–Reno, Pyrenean Institute Of Ecology, University of New Mexico, Arizona State University, the U.S. Forest Service Rocky Mountain Research Station, and the Lamont-Doherty Earth Observatory of Columbia University.

Read the abstract.

The research was funded by the National Science Foundation (grant number DEB EF-1340270) and the NOAA Climate and Global Change Postdoctoral Fellowship program.


Dissecting the ocean’s unseen waves to learn where the heat, energy and nutrients go (Nature)

By Morgan Kelly, Office of Communications

Sonya Legg, Senior Research Oceanographer, Atmospheric and Oceanic Sciences at Princeton University, and a team of colleagues from other institutions created the first-ever model of the world’s most powerful internal ocean waves.
Sonya Legg, a senior research oceanographer in the Program in Atmospheric and Oceanic Sciences at Princeton University, and colleagues from collaborating institutions created the first “cradle to grave” model of the world’s most powerful internal ocean waves.

Beyond the pounding surf loved by novelists and beachgoers alike, the ocean contains rolling internal waves beneath the surface that displace massive amounts of water and push heat and vital nutrients up from the deep ocean.

Internal waves have long been recognized as essential components of the ocean’s nutrient cycle, and key to how oceans will store and distribute additional heat brought on by global warming. Yet, scientists have not until now had a thorough understanding of how internal waves start, move and dissipate.

Researchers from the Office of Naval Research’s multi-institutional Internal Waves In Straits Experiment (IWISE) have published in the journal Nature the first “cradle-to-grave” model of the world’s most powerful internal waves. Caused by the tide, the waves move through the Luzon Strait between southern Taiwan and the Philippine island of Luzon that connects the Pacific Ocean to the South China Sea.

Simulation of waves in Luzon Strait
The complexity of the Luzon Strait’s two-ridge system was not previously known. The Princeton researchers’ simulations showed that the two ridges of the Luzon Strait greatly amplify the size and energy of the wave, well beyond the sum of what the two ridges would generate separately. The simulation above of the tide moving over the second, or western, ridge shows that the tidally-driven flow reaches a high velocity (top) as it moves down the slope (left to right), creating a large wave in density (black lines) with concentrated turbulent energy dissipation (bottom). As the tide moves back over the ridge, the turbulence is swept away. For both the velocity and energy dissipation panels, the color scale indicates the greatest velocity or energy (red) to the least amount (blue). (Image by Maarten Buijsman, University of Southern Mississippi)

Combining computer models constructed largely by Princeton University researchers with on-ship observations, the researchers determined the movement and energy of the waves from their origin on a double-ridge between Taiwan and the Philippines to when they fade off the coast of China. Known to provide nutrients for whales and pose a hazard to shipping, the Luzon Strait internal waves move west at speeds as fast as 3 meters (18 feet) per second and can be as much as 500 meters (1,640 feet) from trough to crest, the researchers found.

The Luzon Strait internal waves provide an ideal archetype for understanding internal waves, explained co-author Sonya Legg, a Princeton senior research oceanographer in the Program in Atmospheric and Oceanic Sciences and a lecturer in geosciences. The distance from the Luzon Strait to China is relatively short — compared to perhaps the Hawaiian internal wave that crosses the Pacific to Oregon — and the South China Sea is relatively free of obstructions such as islands, crosscurrents and eddies, Legg said. Not only did these factors make the waves much more manageable to model and study in the field, but also resulted in a clearer understanding of wave dynamics that can be used to understand internal waves elsewhere in the ocean, she said.

Model of internal waves
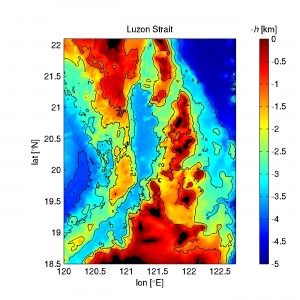
Researchers from the Office of Naval Research’s multi-institutional Internal Waves In Straits Experiment (IWISE) — including from Princeton University — have published the first “cradle-to-grave” model of internal waves, which are subsurface ocean displacements recognized as essential to the distribution of nutrients and heat. The researchers modeled the internal waves that move through the Luzon Strait between southern Taiwan and the Philippine island of Luzon. Part of the Princeton researchers’ role was to simulate when and where the Luzon Strait’s internal waves are strongest as the tide moves westward from the Pacific Ocean into the South China Sea over a unique double-ridge formation in the strait. The above image shows the two underwater ridges — indicated in green, orange and red — between Taiwan (top) and island of Luzon (bottom). The color scale indicates elevation from lowest (blue) to highest (red). (Image by Maarten Buijsman, University of Southern Mississippi)

“We know there are these waves in other parts of the ocean, but they’re hard to look at because there are other things in the way,” Legg said. “The Luzon Strait waves are in a mini-basin, so instead of the whole Pacific to focus on, we had this small sea — it’s much more manageable. It’s a place you can think of as a laboratory in the ocean that’s much simpler than other parts of the ocean.”

Legg and co-author Maarten Buijsman, who worked on the project while a postdoctoral researcher at Princeton and is now an assistant professor of physical oceanography at the University of Southern Mississippi, created computer simulations of the Luzon Strait waves that the researchers in the South China Sea used to determine the best locations to gather data.

For instance, Legg and Buijsman used their models to pinpoint where and when the waves begin with the most energy as the ocean tide crosses westward over the strait’s two underwater ridges. Notably, their models showed that the two ridges greatly amplify the size and energy of the wave, well beyond the sum of what the two ridges would generate separately. The complexity of a two-ridge system was not previously known, Legg said.

The energy coming off the strait’s two ridges steepens as it moves toward China, evolving from a rolling wavelength to a steep “saw-tooth” pattern, Legg said. These are the kind of data the researchers sought to gather — where the energy behind internal waves goes and how it changes on its way. How an internal wave’s energy is dissipated determines the amount of heat and nutrients that are transferred from the cold depths of the lower ocean to the warm surface waters, or vice versa.

Models used to project conditions on an Earth warmed by climate change especially need to consider how the ocean will move excess heat around, Legg said. Heat that stays at the surface will ultimately result in greater sea-level rise as warmer water expands more readily as it heats up. The cold water of the deep, however, expands less for the same input of heat and has a greater capacity to store warm water. If heat goes to the deep ocean, that could greatly increase how much heat the oceans can absorb, Legg said.

As researchers learn more about internal waves such as those in the Luzon Strait, climate models can be tested against what becomes known about ocean mechanics to more accurately project conditions on a warmer Earth, she said.

“Ultimately, we want to know what effect the transportation and storage of heat has on the ocean. Internal waves are a significant piece in the puzzle in telling us where heat is stored,” Legg said. “We have in the Luzon Strait an oceanic laboratory where we can test our theoretical models and simulations to see them play out on a small scale.”

This work supported by the U.S. Office of Naval Research and the Taiwan National Science Council.

Read the abstract

Matthew H. Alford, et al. 2015. The formation and fate of internal waves in the South China Sea. Nature. Arti­cle pub­lished online in-advance-of-print May 7, 2015. DOI: 10.1038/nature14399


Do biofuel policies seek to cut emissions by cutting food? (Science)

By Catherine Zandonella, Office of the Dean for Research

2015_03_27_cornfieldA study published today in the journal Science found that government biofuel policies rely on reductions in food consumption to generate greenhouse gas savings.

Shrinking the amount of food that people and livestock eat decreases the amount of carbon dioxide that they breathe out or excrete as waste. The reduction in food available for consumption, rather than any inherent fuel efficiency, drives the decline in carbon dioxide emissions in government models, the researchers found.

“Without reduced food consumption, each of the models would estimate that biofuels generate more emissions than gasoline,” said Timothy Searchinger, first author on the paper and a research scholar at Princeton University’s Woodrow Wilson School of Public and International Affairs and the Program in Science, Technology, and Environmental Policy.

Searchinger’s co-authors were Robert Edwards and Declan Mulligan of the Joint Research Center at the European Commission; Ralph Heimlich of the consulting practice Agricultural Conservation Economics; and Richard Plevin of the University of California-Davis.

The study looked at three models used by U.S. and European agencies, and found that all three estimate that some of the crops diverted from food to biofuels are not replaced by planting crops elsewhere. About 20 percent to 50 percent of the net calories diverted to make ethanol are not replaced through the planting of additional crops, the study found.

The result is that less food is available, and, according to the study, these missing calories are not simply extras enjoyed in resource-rich countries. Instead, when less food is available, prices go up. “The impacts on food consumption result not from a tailored tax on excess consumption but from broad global price increases that will disproportionately affect some of the world’s poor,” Searchinger said.

The emissions reductions from switching from gasoline to ethanol have been debated for several years. Automobiles that run on ethanol emit less carbon dioxide, but this is offset by the fact that making ethanol from corn or wheat requires energy that is usually derived from traditional greenhouse gas-emitting sources, such as natural gas.

Both the models used by the U.S. Environmental Protection Agency and the California Air Resources Board indicate that ethanol made from corn and wheat generates modestly fewer emissions than gasoline. The fact that these lowered emissions come from reductions in food production is buried in the methodology and not explicitly stated, the study found.

The European Commission’s model found an even greater reduction in emissions. It includes reductions in both quantity and overall food quality due to the replacement of oils and vegetables by corn and wheat, which are of lesser nutritional value. “Without these reductions in food quantity and quality, the [European] model would estimate that wheat ethanol generates 46% higher emissions than gasoline and corn ethanol 68% higher emissions,” Searching said.

The paper recommends that modelers try to show their results more transparently so that policymakers can decide if they wish to seek greenhouse gas reductions from food reductions. “The key lesson is the trade-offs implicit in the models,” Searchinger said.

The research was supported by The David and Lucile Packard Foundation.

Read the abstract.

T. Searchinger, R. Edwards, D. Mulligan, R. Heimlich, and R. Plevin. Do biofuel policies seek to cut emissions by cutting food? Science 27 March 2015: 1420-1422. DOI: 10.1126/science.1261221.

Dirty pool: Soil’s large carbon stores could be freed by increased CO2, plant growth (Nature Climate Change)

By Morgan Kelly, Office of Communications

Soil carbon
Researchers based at Princeton University report that an increase in human-made carbon dioxide in the atmosphere could initiate a chain reaction between plants and microorganisms that would unsettle one of the largest carbon reservoirs on the planet — soil. The researchers developed the first computer model to show at a global scale the complex interaction between carbon, plants and soil. The model projected changes (above) in global soil carbon as a result of root-soil interactions, with blue indicating a greater loss of soil carbon to the atmosphere. (Image by Benjamin Sulman, Princeton Environmental Institute)

An increase in human-made carbon dioxide in the atmosphere could initiate a chain reaction between plants and microorganisms that would unsettle one of the largest carbon reservoirs on the planet — soil.

Researchers based at Princeton University report in the journal Nature Climate Change that the carbon in soil — which contains twice the amount of carbon in all plants and Earth’s atmosphere combined — could become increasingly volatile as people add more carbon dioxide to the atmosphere, largely because of increased plant growth. The researchers developed the first computer model to show at a global scale the complex interaction between carbon, plants and soil, which includes numerous bacteria, fungi, minerals and carbon compounds that respond in complex ways to temperature, moisture and the carbon that plants contribute to soil.

Although a greenhouse gas and pollutant, carbon dioxide also supports plant growth. As trees and other vegetation flourish in a carbon dioxide-rich future, their roots could stimulate microbial activity in soil that in turn accelerates the decomposition of soil carbon and its release into the atmosphere as carbon dioxide, the researchers found.

This effect counters current key projections regarding Earth’s future carbon cycle, particularly that greater plant growth could offset carbon dioxide emissions as flora take up more of the gas, said first author Benjamin Sulman, who conducted the modeling work as a postdoctoral researcher at the Princeton Environmental Institute.

“You should not count on getting more carbon storage in the soil just because tree growth is increasing,” said Sulman, who is now a postdoctoral researcher at Indiana University.

On the other hand, microbial activity initiated by root growth could lock carbon onto mineral particles and protect it from decomposition, which would increase long-term storage of carbon in soils, the researchers report.

Whether carbon emissions from soil rise or fall, the researchers’ model depicts an intricate soil-carbon system that contrasts starkly with existing models that portray soil as a simple carbon repository, Sulman said. An oversimplified perception of the soil carbon cycle has left scientists with a glaring uncertainty as to whether soil would help mitigate future carbon dioxide levels — or make them worse, Sulman said.

“The goal was to take that very simple model and add some of the most important missing processes,” Sulman said. “The main interactions between roots and soil are important and shouldn’t be ignored. Root growth and activity are such important drivers of what goes on in the soil, and knowing what the roots are doing could be an important part of understanding what the soil will be doing.”

The researchers’ soil-carbon cycle model has been integrated into the global land model used for climate simulations by the National Oceanic and Atmospheric Administration’s (NOAA) Geophysical Fluid Dynamics Laboratory (GFDL) located on Princeton’s Forrestal Campus.

Read the abstract

Benjamin N. Sulman, Richard P. Phillips, A. Christopher Oishi, Elena Shevliakova, and Stephen W. Pacala. 2014. Microbe-driven turnover offsets mineral-mediated storage of soil carbon under elevated CO2. Nature Climate Change. Arti­cle pub­lished in December 2014 print edition. DOI: 10.1038/nclimate2436

The work was supported by grants from NOAA (grant no. NA08OAR4320752); the U.S. Department of Agriculture (grant no. 2011-67003-30373); and Princeton’s Carbon Mitigation Initiative sponsored by BP.


With climate change, heat more than natural disasters will drive people away (PNAS)

By Morgan Kelly, Office of Communications

Although scenes of people fleeing from dramatic displays of Mother Nature’s power dominate the news, gradual increases in an area’s overall temperature — and to a lesser extent precipitation — actually lead more often to permanent population shifts, according to Princeton University research.

The researchers examined 15 years of migration data for more than 7,000 families in Indonesia and found that increases in temperature and, to a lesser extent, rainfall influenced a family’s decision to permanently migrate to another of the country’s provinces. They report in the journal the Proceedings of the National Academy of Sciences that increases in average yearly temperature took a detrimental toll on people’s economic wellbeing. On the other hand, natural disasters such as floods and earthquakes had a much smaller to non-existent impact on permanent moves, suggesting that during natural disasters relocation was most often temporary as people sought refuge in other areas of the country before returning home to rebuild their lives.

The results suggest that the consequences of climate change will likely be more subtle and permanent than is popularly believed, explained first author Pratikshya Bohra-Mishra, a postdoctoral research associate in the Program in Science, Technology and Environmental Policy (STEP) in Princeton’s Woodrow Wilson School of Public and International Affairs. The effects likely won’t be limited to low-lying areas or developing countries that are unprepared for an uptick in hurricanes, floods and other natural disasters, she said.

“We do not think of ‘environmental migrants’ in a broader sense; images of refugees from natural disasters often dominate the overall picture,” Bohra-Mishra said. “It is important to understand the often less conspicuous and gradual effect of climate change on migration. Our study suggests that in areas that are already hot, a further increase in temperature will increase the likelihood that more people will move out.”

Indonesia’s tropical climate and dependence on agriculture may amplify the role of temperature as a migration factor, Bohra-Mishra said. However, existing research shows that climate-driven changes in crop yields can effect Mexican migration to the United States, and that extreme temperature had a role in the long-term migration of males in rural Pakistan.

“Based on these emerging findings, it is likely that the societal reach of climate change could be much broader to include warm regions that are now relatively safe from natural disasters,” Bohra-Mishra said.

Indonesia became the case study because the multi-island tropical nation is vulnerable to climate change and events such as earthquakes and landslides. In addition, the Indonesian Family Life Survey (IFLS) conducted by the RAND Corporation from 1993 to 2007 provided thorough information about the movements of 7,185 families from 13 of the nation’s 27 provinces in 1993. The Princeton researchers matched province-to-province movement of households over 15 years to data on temperature, precipitation and natural disasters from those same years. Bohra-Mishra worked with co-authors Michael Oppenheimer, the Albert G. Millbank Professor of Geosciences and International Affairs and director of STEP, and Solomon Hsiang, a past Princeton postdoctoral researcher now an assistant professor of public policy at the University of California-Berkeley.

People start to rethink their location with each degree that the average annual temperature rises above 25 degrees Celsius (77 degrees Fahrenheit), the researchers found. The chances that a family will leave an area for good in a given year rise with each degree. With a change from 26 to 27 degrees Celsius (78.8 to 80.6 Fahrenheit), the probability of a family emigrating that year increased by 0.8 percent when other factors for migration were controlled for. From 27 to 28 degrees Celsius (80.6 to 82.4 Fahrenheit), those chances jumped to 1.4 percent.

When it comes to annual rainfall, families seem to tolerate and prefer an average of 2.2 meters (7.2 feet). The chances of outmigration increased with each additional meter of average annual precipitation, as well as with further declines in rainfall.

Landslides were the only natural disaster with a consistent positive influence on permanent migration. With every 1 percent increase in the number of deaths or destroyed houses in a family’s home province, the likelihood of permanent migration went up by only 0.0006 and 0.0004 percent, respectively.

The much higher influence of heat on permanent migration can be pinned on its effect on local economies and social structures, the researchers write. Previous research has shown that a one-degree change in the average growing-season temperature can reduce yields of certain crops by as much as 17 percent. At the same time, research conducted by Hsiang while at Princeton and published in 2013 showed a correlation between higher temperatures and social conflict such as civil wars, ethnic conflict and street crime.

In the current study, the researchers found that in Indonesia, a shift from 25 to 26 degrees Celsius resulted in a significant 14 to 15 percent decline in the value of household assets, for example. Precipitation did not have a notable affect on household worth, nor did natural disasters except landslides, which lowered assets by 5 percent for each 1 percent increase in the number of people who died.

Read the abstract.

Bohra-Mishra, Pratikshya, Michael Oppenheimer, Solomon Hsiang. 2014. Nonlinear permanent migration response to climatic variations but minimal response to disasters. Proceedings of the National Academy of Sciences. Article published online June 23, 2014. DOI: 10.1073/pnas.1317166111.

Public interest in climate change unshaken by scandal, but unstirred by science (Environ. Res. Lett.)

Public interest in climate change
Princeton University and University of Oxford researchers found that negative media reports seem to have only a passing effect on public opinion, but that positive stories don’t appear to possess much staying power, either. Measured by how often people worldwide scour the Internet for information related to climate change, overall public interest in the topic has steadily waned since 2007. To gauge public interest, the researchers used Google Trends to document the Internet search-engine activity for “global warming” (blue line) and “climate change” (red line) from 2004 to 2013. They examined activity both globally (top) and in the United States (bottom). The numbers on the left indicate how often people looked up each term based on its percentage of the maximum search volume at any given point in time. (Image courtesy of William Anderegg)

By Morgan Kelly, Office of Communications

The good news for any passionate supporter of climate-change science is that negative media reports seem to have only a passing effect on public opinion, according to Princeton University and University of Oxford researchers. The bad news is that positive stories don’t appear to possess much staying power, either. This dynamic suggests that climate scientists should reexamine how to effectively and more regularly engage the public, the researchers write.

Measured by how often people worldwide scour the Internet for information related to climate change, overall public interest in the topic has steadily waned since 2007, according to a report in the journal Environmental Research Letters. Yet, the downturn in public interest does not seem tied to any particular negative publicity regarding climate-change science, which is what the researchers primarily wanted to gauge.

First author William Anderegg, a postdoctoral research associate in the Princeton Environmental Institute who studies communication and climate change, and Gregory Goldsmith, a postdoctoral researcher at Oxford’s Environmental Change Institute, specifically looked into the effect on public interest and opinion of two widely reported, almost simultaneous events.

The first involved the November 2009 hacking of emails from the Climate Research Unit at the University of East Anglia in the United Kingdom, which has been a preeminent source of data confirming human-driven climate change. Known as “climategate,” this event was initially trumpeted as proving that dissenting scientific views related to climate change have been maliciously quashed. Thorough investigations later declared that no misconduct took place.

The second event was the revelation in late 2009 that an error in the 2007 Fourth Assessment Report of the Intergovernmental Panel on Climate Change (IPCC) — an organization under the auspices of the United Nations that periodically evaluates the science and impacts of climate change — overestimated how quickly glaciers in the Himalayas would melt.

To first get a general sense of public interest in climate change, Anderegg and Goldsmith combed the freely available database Google Trends for “global warming,” “climate change” and all related terms that people around the world searched for between 2004 and 2013. The researchers documented search trends in English, Chinese and Spanish, which are the top three languages on the Internet. Google Trends receives more than 80 percent of the world’s Internet search-engine activity, and it is increasingly called upon for research in economics, political science and public health.

Internet searches related to climate change began to climb following the 2006 release of the documentary “An Inconvenient Truth” starring former vice president Al Gore, and continued its ascent with the release of the IPCC’s fourth report, the researchers found.

Anderegg and Goldsmith specifically viewed searches for “climategate” between Nov. 1 and Dec. 31, 2009. They found that the search trend had a six-day “half-life,” meaning that search frequency dropped by 50 percent every six days. After 22 days, the number of searches for climategate was a mere 10 percent of its peak. Information about climategate was most sought in the United States, Canada and Australia, while the cities with the most searchers were Toronto, London and Washington, D.C.

Searches for the phrase "global warming hoax" correlate with conservative political leanings
The researchers found that searchers for the phrase “global warming hoax” and related terms correlate in the United States with Republican or conservative political leanings. They compared the prevalence of searches for “global warming hoax” with the Cook Partisan Voting Index — which gauges how far toward Republicans or Democrats a congressional district leans — for 34 US states (above). They found that the more Republican/conservative the state (bottom measurement), the more frequently people in that state looked up related terms. The bottom graph shows how often a state votes Democrat (low numbers) versus Republican (high numbers). The numbers on the left indicate how often people looked up “global warming hoax” based on its percentage of the maximum search volume at any given point in time. (Image courtesy of William Anderegg)

The researchers tracked the popularity of the term “global warming hoax” to gauge the overall negative effect of climategate and the IPCC error on how the public perceives climate change. They found that searches for the term were actually higher the year before the events than during the year afterward.

“The search volume quickly returns to the same level as before the incident,” Goldsmith said. “This suggests no long-term change in the level of climate-change skepticism.

We found that intense media coverage of an event such as ‘climategate’ was followed by bursts of public interest, but these bursts were short-lived.”

All of this is to say that moments of great consternation for climate scientists seem to barely register in the public consciousness, Anderegg said. The study notes that independent polling data also indicate that these events had very little effect on American public opinion. “There’s a lot of handwringing among scientists, and a belief that these events permanently damaged public trust. What these results suggest is that that’s just not true,” Anderegg said.

While that’s good in a sense, Anderegg said, his and Goldsmith’s results also suggest that climate change as a whole does not top the list of gripping public topics. For instance, he said, climategate had the same Internet half-life as the public fallout from pro-golfer Tiger Woods’ extramarital affair, which happened around the same time (but received far more searches).

A public with little interest in climate change is unlikely to push for policies that actually address the problem, Anderegg said. He and Goldsmith suggest communicating in terms familiar to the public rather than to scientists. For example, their findings suggest that most people still identify with the term “global warming” instead of “climate change,” though the shift toward embracing the more scientific term is clear.

“If public interest in climate change is falling, it may be more difficult to muster public concern to address climate change,” Anderegg said. “This long-term trend of declining interest is worrying and something I hope we can address soon.”

One outcome of the research might be to shift scientists’ focus away from battling short-lived, so-called scandals, said Michael Oppenheimer, Princeton’s Albert G. Milbank Professor of Geosciences and International Affairs. The study should remind climate scientists that every little misstep or controversy does not make or break the public’s confidence in their work, he said. Oppenheimer, who was not involved in the study, is a long-time participant in the IPCC and an author of the Fifth Assessment Report being released this year in sections.

“This is an important study because it puts scientists’ concerns about climate skepticism in perspective,” Oppenheimer said. “While scientists should maintain the aspirational goal of their work being error-free, they should be less distracted by concerns that a few missteps will seriously influence attitudes in the general public, which by-and-large has never heard of these episodes.”

Read the article.

Anderegg, William R. L., Gregory R. Goldsmith. 2014. Public interest in climate change over the past decade and the effects of the ‘climategate’ media event. Environmental Research Letters 9 054005. doi:10.1088/1748-9326/9/5/054005 Article published online May 20, 2014.

A more potent greenhouse gas than CO2, methane emissions will leap as Earth warms (Nature)

Freshwater wetlands can release methane, a potent greenhouse gas, as the planet warms. (Image source: RGBstock.com)

By Morgan Kelly, Office of Communications

While carbon dioxide is typically painted as the bad boy of greenhouse gases, methane is roughly 30 times more potent as a heat-trapping gas. New research in the journal Nature indicates that for each degree that the Earth’s temperature rises, the amount of methane entering the atmosphere from microorganisms dwelling in lake sediment and freshwater wetlands — the primary sources of the gas — will increase several times. As temperatures rise, the relative increase of methane emissions will outpace that of carbon dioxide from these sources, the researchers report.

The findings condense the complex and varied process by which methane — currently the third most prevalent greenhouse gas after carbon dioxide and water vapor — enters the atmosphere into a measurement scientists can use, explained co-author Cristian Gudasz, a visiting postdoctoral research associate in Princeton’s Department of Ecology and Evolutionary Biology. In freshwater systems, methane is produced as microorganisms digest organic matter, a process known as “methanogenesis.” This process hinges on a slew of temperature, chemical, physical and ecological factors that can bedevil scientists working to model how the Earth’s systems will contribute, and respond, to a hotter future.

The researchers’ findings suggest that methane emissions from freshwater systems will likely rise with the global temperature, Gudasz said. But to not know the extent of methane contribution from such a widely dispersed ecosystem that includes lakes, swamps, marshes and rice paddies leaves a glaring hole in climate projections.

“The freshwater systems we talk about in our paper are an important component to the climate system,” Gudasz said. “There is more and more evidence that they have a contribution to the methane emissions. Methane produced from natural or manmade freshwater systems will increase with temperature.”

To provide a simple and accurate way for climate modelers to account for methanogenesis, Gudasz and his co-authors analyzed nearly 1,600 measurements of temperature and methane emissions from 127 freshwater ecosystems across the globe.

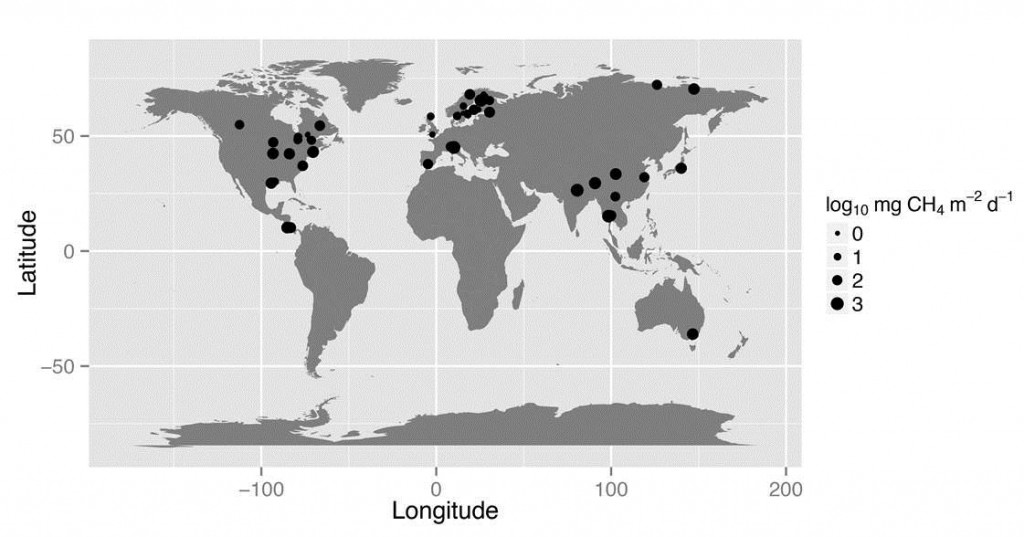
New research in the journal Nature found that for each degree that the Earth's temperature rises, the amount of methane entering the atmosphere from microorganisms dwelling in freshwater wetlands — a primary source of the gas — will increase several times. The researchers analyzed nearly 1,600 measurements of temperature and methane emissions from 127 freshwater ecosystems across the globe (above), including lakes, swamps, marshes and rice paddies. The size of each point corresponds with the average rate of methane emissions in milligrams per square meter, per day, during the course of the study. The smallest points indicate less than one milligram per square meter, while the largest-sized point represents more than three milligrams. (Image courtesy of Cristian Gudasz)
New research in the journal Nature found that for each degree that the Earth’s temperature rises, the amount of methane entering the atmosphere from microorganisms dwelling in freshwater wetlands — a primary source of the gas — will increase several times. The researchers analyzed nearly 1,600 measurements of temperature and methane emissions from 127 freshwater ecosystems across the globe (above), including lakes, swamps, marshes and rice paddies. The size of each point corresponds with the average rate of methane emissions in milligrams per square meter, per day, during the course of the study. The smallest points indicate less than one milligram per square meter, while the largest-sized point represents more than three milligrams. (Image courtesy of Cristian Gudasz)

The researchers found that a common effect emerged from those studies: freshwater methane generation very much thrives on high temperatures. Methane emissions at 0 degrees Celsius would rise 57 times higher when the temperature reached 30 degrees Celsius, the researchers report. For those inclined to model it, the researchers’ results translated to a temperature dependence of 0.96 electron volts (eV), an indication of the temperature-sensitivity of the methane-emitting ecosystems.

“We all want to make predictions about greenhouse gas emissions and their impact on global warming,” Gudasz said. “Looking across these scales and constraining them as we have in this paper will allow us to make better predictions.”

Read the abstract.

Yvon-Durocher, Gabriel, Andrew P. Allen, David Bastviken, Ralf Conrad, Cristian Gudasz, Annick St-Pierre, Nguyen Thanh-Duc, Paul A. del Giorgio. 2014. Methane fluxes show consistent temperature dependence across microbial to ecosystem scales. Nature. Article published online before print: March 19, 2014. DOI: 10.1038/nature13164 and in the March 27, 2014 print edition.

Model anticipates ecological impacts of human responses to climate (Conservation Biology)

A Princeton University research team has created a readily transferable method for conservation planners trying to anticipate how agriculture will be affected by such adaptations. The tested their model by studying wheat and maize production in South Africa. (Image source: WWS)

By B. Rose Huber, Woodrow Wilson School of Public and International Affairs

Throughout history, humans have responded to climate.

Take, for example, the Mayans, who, throughout the eighth and 10th centuries, were forced to move away from their major ceremonial centers after a series of multi-year droughts, bringing about agricultural expansion in Mesoamerica, and a clearing of forests. Much later, in the late 20th century, frequent droughts caused the people of Burkina Faso in West Africa to migrate from the dry north to the wetter south where they have transformed forests to croplands and cut the nation’s area of natural vegetation in half.

Such land transformations, while necessary to ensure future crop productivity, can themselves have large ecological impacts, but few studies have examined their effects. To that end, a Princeton University research team has created a model to evaluate how a human response to climate change may alter the agricultural utility of land. The study, featured in Conservation Biology, provides a readily transferable method for conservation planners trying to anticipate how agriculture will be affected by such adaptations.

“Humans can transform an ecosystem much more rapidly and completely than it can be altered by shifting temperature and precipitation patterns,” said Lyndon Estes, lead author and associate research scholar in the Woodrow Wilson School of International and Public Affairs. “This model provides an initial approach for understanding how agricultural land-use might shift under climate change, and therefore which currently natural areas might be converted to farming.”

Under the direction of faculty members Michael Oppenheimer and David Wilcove, both from the Wilson School’s Program in Science, Technology and Policy, and with the help of visiting student research collaborator Lydie-Line Paroz from ETH Zurich and colleagues from several other institutions, Estes studied South Africa, an area projected to be vulnerable to climate change where wheat and maize are the dominant crops.

Before determining how climate change could impact the crops, the team first needed to determine which areas have been or might be farmed for maize and wheat. They created a land-use model based on an area’s potential crop output and simulated how much of each crop was grown from 1979 to 1999 – the two decades for which historical weather data was available. They also calculated the ruggedness of each area of land, which is related to the cost of farming it. Taking all factors into account, the model provides an estimate of whether the land is likely to be profitable or unprofitable for farming.

To investigate any climate-change impacts, the team then examined the production of wheat and maize under 36 different climate-response scenarios. Many possible future climates were taken into account as well as how the crops might respond to rising levels of carbon dioxide. Based on their land-use model, the researchers calculated how the climate-induced productivity changes alter a land’s agricultural utility. In their analysis, they included only conservation lands – current nature reserves and those that South African conservation officials plan to acquire – that contained land suitable for growing one of the two crops either currently or in the future. However, Estes said the model could be adapted to assess whether land under other types of uses (besides conservation) are likely to be profitable or unprofitable for future farming.

They found that most conservation lands currently have low agricultural utility because of their rugged terrain, which makes them difficult to farm, and that they are likely to stay that way under future climate-change scenarios. The researchers did pinpoint several areas that could become more valuable for farming in the future, putting them at greater risk of conversion. However, some areas were predicted to decrease value for farming, which could make them easier to protect and conserve.

“While studying the direct response of species to climatic shifts is important, it’s only one piece of a complicated puzzle. A big part of that puzzle relates to how humans will react, and history suggests you don’t need much to trigger a change in the way land is used that has a fairly long-lasting impact. ” said Estes. “We hope that conservation planners can use this approach to start thinking about human climate change adaptation and how it will affect areas needing protection.”

Other researchers involved in the study include: Lydie-Line Paroz, Swiss Federal Institute of Technology; Bethany A. Bradley, University of Massachusetts; Jonathan Green, STEP; David G. Hole, Conservation International; Stephen Holness, Centre for African Conservation Ecology; and Guy Ziv, University of Leeds.

The work was funded by the Princeton Environmental Institute‘s Grand Challenges Program.

Read the abstract.

Estes LD, Paroz LL, Bradley BA, Green JM, Hole DG, Holness S, Ziv G, Oppenheimer MG, Wilcove DS. Using Changes in Agricultural Utility to Quantify Future Climate-Induced Risk to Conservation Conservation Biology (2013). First published online Dec. 26, 2013.

How will crops fare under climate change? Depends on how you ask (Global Change Biology)

Research image
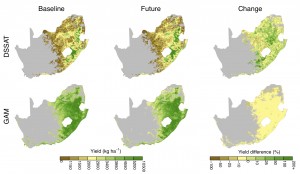
Mechanistic (top row) and empirical (bottom row) simulations compared recent, or “baseline,” maize production in South Africa (1979-99) to projected future production under climate change (2046-65). While both models showed a reduction in output, the third column shows that the empirical model estimated a widespread yield loss of around 10 percent (in yellow), while the mechanistic model showed several areas of increased production (in green). (Image by Lyndon Estes)
Research image 2
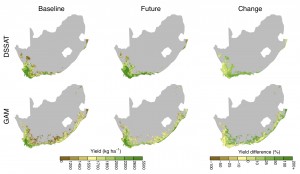
For wheat, the mechanistic model (top row) projected greater wheat yields, while the empirical model (bottom row) suggested that wheat-growing areas would expand by almost 50 percent. (Image by Lyndon Estes)

By Morgan Kelly, Office of Communications

The damage scientists expect climate change to do to crop yields can differ greatly depending on which type of model was used to make those projections, according to research based at Princeton University. The problem is that the most dire scenarios can loom large in the minds of the public and policymakers, yet neither audience is usually aware of how the model itself influenced the outcome, the researchers said.

The report in the journal Global Change Biology is one of the first to compare the agricultural projections generated by empirical models — which rely largely on field observations — to those by mechanistic models, which draw on an understanding of how crop growth and development are affected by the environment. Building on similar studies from ecology, the researchers found yet more evidence that empirical models may show greater losses as a result of climate change, while mechanistic models may be overly optimistic.

The researchers ran an empirical and a mechanistic model to see how maize and wheat crops in South Africa — the world’s ninth largest maize producer, and sub-Saharan Africa’s second largest source of wheat — would fare under climate change in the years 2046 to 2065. Under the hotter, wetter conditions projected by the climate scenarios they used, the empirical model estimated that maize production could drop by 3.6 percent, while wheat output could increase by 6.2 percent. Meanwhile, the mechanistic model calculated that maize and wheat yields might go up by 6.5 and 15.2 percent, respectively.

In addition, the empirical model estimated that suitable land for growing wheat would drop by 10 percent, while the mechanistic model found that it would expand by 9 percent. The empirical model projected a 48 percent expansion in wheat-growing areas, but the mechanistic reported only 20 percent growth. In regions where the two models overlapped, the empirical model showed declining yields while the mechanistic model showed increases. These wheat models were less accurate, but still indicative of the vastly different estimates empirical and mechanistic can produce, the researchers wrote.

Disparities such as these aren’t just a concern for climate-change researchers, said first author Lyndon Estes, an associate research scholar in the Program in Science, Technology and Environmental Policy in Princeton’s Woodrow Wilson School of Public and International Affairs. Impact projections are crucial as people and governments work to understand and address climate change, but it also is important that people understand how they are generated and the biases inherent in them, Estes said. The researchers cite previous studies that suggest climate change will reduce South African maize and wheat yields by 28 to 30 percent — according to empirical studies. Mechanistic models project a more modest 10 to 19 percent loss. What’s a farmer or government minister to believe?

“A yield projection based only on empirical models is likely to show larger yield losses than one made only with mechanistic models. Neither should be considered more right or wrong, but people should be aware of these differences,” Estes said. “People who are interested in climate-change science should be aware of all the sources of uncertainty inherent in projections, and should be aware that scenarios based on a single model — or single class of models — are not accounting for one of the major sources of uncertainty.”

The researchers’ work relates to a broader effort in recent years to examine the biases introduced into climate estimates by the models and data scientists use, Estes said. For instance, a paper posted Aug. 7 by Global Change Biology — and includes second author and 2011 Princeton graduate Ryan Huynh — challenges predictions that higher global temperatures will result in the widespread extinction of cold-blooded forest creatures, particularly lizards. These researchers say that a finer temperature scale than existing projections use suggests that many cold-blooded species would indeed thrive on a hotter Earth.

Scientists are aware of the differences between empirical and mechanistic models, said Estes, who was prompted by a similar comparison that showed an empirical-mechanistic divergence in tree-growth models. Yet, only one empirical-to-mechanistic comparison (of which Estes also was first author) has been published in relation to agriculture — and it didn’t even examine the impact of climate change.

The solution would be to use both model classes so that researchers could identify each class’s biases and correct for it, Estes said. Each model has different strengths and weaknesses that can be complementary when combined.

Simply put, empirical models are built by finding the relationship between observed crop yields and historical environmental conditions, while mechanistic models are built on the physiological understanding of how the plant grows and reproduces in response to a range of conditions. Empirical models, which are simpler and require fewer inputs, are a staple in studying the possible effects of climate change on ecological systems, where the data and knowledge about most species is largely unavailable. Mechanistic models are more common in studying agriculture because there is a much greater wealth of data and knowledge that has accumulated over several thousand years of agricultural development, Estes said.

“These two model classes characterize different portions of the environmental space, or niche, that crops and other species occupy,” Estes said. “Using them together gives us a better sense of the range of uncertainty in the projections and where the errors and limitations are in the data and models. Because the two model classes have such different structures and assumptions, they also can improve our confidence in scenarios where their findings agree.”

Read the abstract.

Estes, Lyndon D., Hein Beukes, Bethany A. Bradley, Stephanie R. Debats, Michael Oppenheimer, Alex C. Ruane, Roland Schulze and Mark Tadross. 2013. Projected climate impacts to South African maize and wheat production in 2055: A comparison of empirical and mechanistic modeling approaches. Global Change Biology. Accepted, unedited article first published online: July 17, 2013. DOI: 10.1111/gcb.12325

The work was funded by the Princeton Environmental Institute‘s Grand Challenges Program.

How the ice ages ended (Nature)

by Catherine Zandonella, Office of the Dean for Research

Antarctica. Photo credit: Harley D. Nygren, NOAA

A study of sediment cores collected from the deep ocean supports a new explanation for how glacier melting at the end of the ice ages led to the release of carbon dioxide from the ocean.

The study published in Nature suggests that melting glaciers in the northern hemisphere caused a disruption of deep ocean currents, leading to the release of trapped carbon dioxide from the Southern Ocean around Antarctica.

Understanding what happened when previous glaciers melted could help climate researchers make accurate predictions about future global temperature increases and their effects on the planet.

The evidence is strong that ice ages are driven by periodic changes in the amount of sunlight reaching the poles due to cyclic changes in Earth’s rotation and orbit. Yet scientists have been puzzled by evidence that although the timing of ice ages are best explained by changes in sunlight in the northern part of the globe, the warming at the end of ice ages occurred first in the southern hemisphere, with a rise in carbon dioxide levels appearing to be cued from the south.

The new study suggests that changes in ocean currents, connecting the north to the south through the deep ocean, were to blame.

As glaciers melted in the northern reaches of the globe (far upper left), the influx of freshwater, which is naturally less dense than salt-laden ocean water, reduced the normally strong sinking of water in that region. This allowed silicate-rich deep water to rise upward into the shallower ocean waters (upward blue arrows), stimulating the production of opal by diatoms, while warm surface water mixed downward (red arrows) into the southern-sourced deep water. The rising silicate-rich water drew dense cold water from near Antarctica, yielding a cycle of water movement (in yellow). The new circulation pattern caused the carbon dioxide stored in the deep water to be released to the atmosphere near Antarctica (far upper right). Image source: Daniel Sigman.
As glaciers melted in the northern reaches of the globe (far upper left), the influx of freshwater, which is naturally less dense than salt-laden ocean water, caused a reduction in the normally strong sinking of water in that region. This allowed silicate-rich deep water to rise upward into the shallower ocean waters (upward blue arrows), stimulating the production of opal by diatoms, while warm surface water mixed downward (red arrows) into the southern-sourced deep water. The rising silicate-rich water drew dense cold water from near Antarctica, yielding a cycle of water movement (in yellow). The new circulation pattern caused carbon dioxide stored in the deep water to be released to the atmosphere near Antarctica (far upper right). Image source: Daniel Sigman.

Part of this story was suggested more than a decade ago and is already accepted by many climate scientists: As glaciers in the north started melting, the influx of fresh water diluted the salty waters that today flow to the north from the tropics as an extension of the Gulf Stream. Normally, these salty waters become cool and sink into the deep ocean, forming cold and dense water that flows southward, and allowing more salty tropical water to take its place in a sort of ocean conveyor belt. But the influx of fresh water due to melting glaciers stalled the conveyor belt.

So how did this lead to changes in the southern hemisphere?

The new research suggests that the shutdown in northern sinking water allowed southern-sourced water to fill up the deep Atlantic, setting up a new ocean circulation pattern. This new circulation pattern brought deep-sea water, which was rich in carbon dioxide due to sunken dead marine algae, to the surface near Antarctica, where the gas escaped into the atmosphere and acted to drive global warming.  (See diagram.)

The researchers included investigators from ETH Zürich, Princeton University, the University of Miami, the University of British Columbia, and the University of Bremen and the Alfred Wegener Institute in Germany. The Princeton effort was led by Daniel Sigman, the Dusenbury Professor of Geological and Geophysical Sciences.

The team tracked these historic movements of water through the study of sediment cores that are rich in silicon dioxide, or opal. Tiny marine algae known as diatoms make their cell walls out of opal, and when the organisms die, their opal remains sink to the deep sea bed.

The researchers looked at opal in sediment core samples drilled from deep beneath the ocean floor off the coast of northwest Africa and Antarctica. The team found that each period of glacier melting, which occurred five times over the last 550 thousand years, corresponded to a spike in the amount of the opal in the sediment, signaling an increase in diatom growth. The timing of the opal spikes provides evidence that the deep, opal-rich waters in the south were drawn to the surface in response to new meltwater entering the northern ocean.

The mechanism clashes with a previously offered explanation of why the melting of the northern glaciers, or deglaciations, leads to the release of ocean carbon dioxide from the Southern Ocean – the theory that the melting glaciers in the north increased southern hemisphere westerly winds, which in turn caused upwelling of Southern Ocean deep waters. “While distinguishing between these alternatives is important,” says Sigman, “the greater challenge is to test and understand a premise that is shared by both of these scenarios: that ice age conditions around Antarctica caused the deep ocean to be sluggish and rich in carbon dioxide. If this was really how the ice age ocean operated, then it calls for us to reconsider how we expect deep ocean circulation to respond to modern global warming.”

Read the abstract.

A. N. Meckler, D. M. Sigman, K. A. Gibson, R. François, A. Martínez-García, S. L. Jaccard, U. Röhl, L. C. Peterson, R. Tiedemann & G. H. Haug. 2013. Deglacial pulses of deep-ocean silicate into the subtropical North Atlantic Ocean. Nature 495 (7442), 495-498. doi:10.1038/nature12006. Published online 27 March, 2013.

This research used samples provided by the ODP, which is sponsored by the US National Science Foundation (NSF) and participating countries under the management of the Joint Oceanographic Institutions. XRF data were acquired at the XRF Core Scanner Lab at MARUM – Center for Marine Environmental Sciences, University of Bremen, with support from the DFG-Leibniz Center for Surface Process and Climate Studies at the University of Potsdam. Further support was provided by the US NSF through grant OCE-1060947 to D.M.S. and by NSERC and CFCAS to R.F.