Princeton-led team produces 3-D map of Earth’s interior

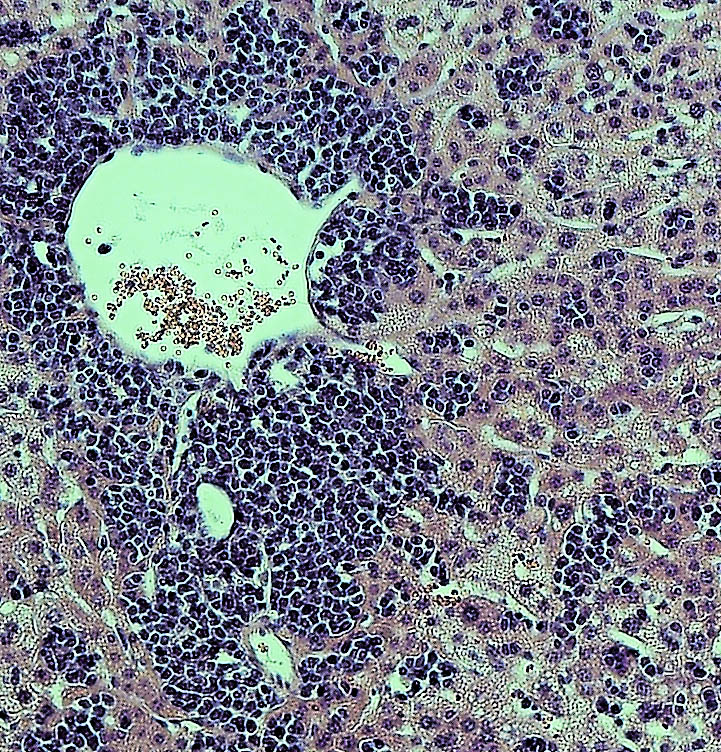
Magna plumes and hotspots, such as the one below Yellowstone, are visible in this subterranean simulation. (Credit: David Pugmire, ORNL)

By Jonathan Hines, Oak Ridge National Laboratory

Because of Earth’s layered composition, scientists have often compared the basic arrangement of its interior to that of an onion. There’s the familiar thin crust of continents and ocean floors; the thick mantle of hot, semisolid rock; the molten metal outer core; and the solid iron inner core.

But unlike an onion, peeling back Earth’s layers to better explore planetary dynamics isn’t an option, forcing scientists to make educated guesses about our planet’s inner life based on surface-level observations. Clever imaging techniques devised by computational scientists, however, offer the promise of illuminating Earth’s subterranean secrets.

Using advanced modeling and simulation, seismic data generated by earthquakes, and one of the world’s fastest supercomputers, a team led by Jeroen Tromp of Princeton University is creating a detailed 3-D picture of Earth’s interior. Currently, the team is focused on imaging the entire globe from the surface to the core–mantle boundary, a depth of 1,800 miles.

These high-fidelity simulations add context to ongoing debates related to Earth’s geologic history and dynamics, bringing prominent features like tectonic plates, magma plumes, and hotspots into view. In September 2016, the team published a paper in Geophysical Journal International on its first-generation global model. Created using data from 253 earthquakes captured by seismograms scattered around the world, the team’s model is notable for its global scope and high scalability.

“This is the first global seismic model where no approximations—other than the chosen numerical method—were used to simulate how seismic waves travel through the Earth and how they sense heterogeneities,” said Ebru Bozdag, a coprincipal investigator of the project and an assistant professor of geophysics at the University of Nice Sophia Antipolis. “That’s a milestone for the seismology community. For the first time, we showed people the value and feasibility of running these kinds of tools for global seismic imaging.”

The project’s genesis can be traced to a seismic imaging theory first proposed in the 1980s. To fill in gaps within seismic data maps, the theory posited a method called adjoint tomography, an iterative full-waveform inversion technique. This technique leverages more information than competing methods, using forward waves that travel from the quake’s origin to the seismic receiver and adjoint waves, which are mathematically derived waves that travel from the receiver to the quake.

The problem with testing this theory? “You need really big computers to do this,” Bozdag said, “because both forward and adjoint wave simulations are performed in 3-D numerically.”

In 2012, just such a machine arrived in the form of the Titan supercomputer, a 27-petaflop Cray XK7 managed by the US Department of Energy’s (DOE’s) Oak Ridge Leadership Computing Facility (OLCF), a DOE Office of Science User Facility located at DOE’s Oak Ridge National Laboratory. After trying out its method on smaller machines, Tromp, who is Princeton’s Blair Professor of Geology and a professor of geosciences and applied and computational mathematics, and his team gained access to Titan in 2013 through the Innovative and Novel Computational Impact on Theory and Experiment, or INCITE, program.

Working with OLCF staff, the team continues to push the limits of computational seismology to deeper depths.

Stitching together seismic slices

When an earthquake strikes, the release of energy creates seismic waves that often wreak havoc for life at the surface. Those same waves, however, present an opportunity for scientists to peer into the subsurface by measuring vibrations passing through the Earth.

As seismic waves travel, seismograms can detect variations in their speed. These changes provide clues about the composition, density, and temperature of the medium the wave is passing through. For example, waves move slower when passing through hot magma, such as mantle plumes and hotspots, than they do when passing through colder subduction zones, locations where one tectonic plate slides beneath another.

Each seismogram represents a narrow slice of the planet’s interior. By stitching many seismograms together, researchers can produce a 3-D global image, capturing everything from magma plumes feeding the Ring of Fire, to Yellowstone’s hotspots, to subducted plates under New Zealand.

This process, called seismic tomography, works in a manner similar to imaging techniques employed in medicine, where 2-D x-ray images taken from many perspectives are combined to create 3-D images of areas inside the body.

In the past, seismic tomography techniques have been limited in the amount of seismic data they can use. Traditional methods forced researchers to make approximations in their wave simulations and restrict observational data to major seismic phases only. Adjoint tomography based on 3-D numerical simulations employed by Tromp’s team isn’t constrained in this way. “We can use the entire data—anything and everything,” Bozdag said.

Running its GPU version of the SPECFEM3D_GLOBE code, Tromp’s team used Titan to apply full-waveform inversion at a global scale. The team then compared these “synthetic seismograms” with observed seismic data supplied by the Incorporated Research Institutions for Seismology (IRIS), calculating the difference and feeding that information back into the model for further optimization. Each repetition of this process improves global models.

“This is what we call the adjoint tomography workflow, and at a global scale it requires a supercomputer like Titan to be executed in reasonable timeframe,” Bozdag said. “For our first-generation model, we completed 15 iterations, which is actually a small number for these kinds of problems. Despite the small number of iterations, our enhanced global model shows the power of our approach. This is just the beginning, however.”

Automating to augment

For its initial global model, Tromp’s team selected earthquake events that registered between 5.8 and 7 on the Richter scale—a standard for measuring earthquake intensity. That range can be extended slightly to include more than 6,000 earthquakes in the IRIS database—about 20 times the amount of data used in the original model.

Getting the most out of all the available data requires a robust automated workflow capable of accelerating the team’s iterative process. Collaborating with OLCF staff, Tromp’s team has made progress toward this goal.

For the team’s first-generation model, Bozdag carried out each step of the workflow manually, taking about a month to complete one model update. Team members Matthieu Lefebvre, Wenjie Lei, and Youyi Ruan of Princeton University and the OLCF’s Judy Hill developed new automated workflow processes that hold the promise of reducing that cycle to a matter of days.

“Automation will really make it more efficient, and it will also reduce human error, which is pretty easy to introduce,” Bozdag said.

Additional support from OLCF staff has contributed to the efficient use and accessibility of project data. Early in the project’s life, Tromp’s team worked with the OLCF’s Norbert Podhorszki to improve data movement and flexibility. The end result, called Adaptable Seismic Data Format (ASDF), leverages the Adaptable I/O System (ADIOS) parallel library and gives Tromp’s team a superior file format to record, reproduce, and analyze data on large-scale parallel computing resources.

In addition, the OLCF’s David Pugmire helped the team implement in situ visualization tools. These tools enabled team members to check their work more easily from local workstations by allowing visualizations to be produced in conjunction with simulation on Titan, eliminating the need for costly file transfers.

“Sometimes the devil is in the details, so you really need to be careful and know what you’re looking at,” Bozdag said. “David’s visualization tools help us to investigate our models and see what is there and what is not.”

With visualization, the magnitude of the team’s project comes to light. The billion-year cycle of molten rock rising from the core–mantle boundary and falling from the crust—not unlike the motion of globules in a lava lamp—takes form, as do other geologic features of interest.

At this stage, the resolution of the team’s global model is becoming advanced enough to inform continental studies, particularly in regions with dense data coverage. Making it useful at the regional level or smaller, such as the mantle activity beneath Southern California or the earthquake-prone crust of Istanbul, will require additional work.

“Most global models in seismology agree at large scales but differ from each other significantly at the smaller scales,” Bozdag said. “That’s why it’s crucial to have a more accurate image of Earth’s interior. Creating high-resolution images of the mantle will allow us to contribute to these discussions.”

Digging deeper

To improve accuracy and resolution further, Tromp’s team is experimenting with model parameters under its most recent INCITE allocation. For example, the team’s second-generation model will introduce anisotropic inversions, which are calculations that better capture the differing orientations and movement of rock in the mantle. This new information should give scientists a clearer picture of mantle flow, composition, and crust–mantle interactions.

Additionally, team members Dimitri Komatitsch of Aix-Marseille University in France and Daniel Peter of King Abdullah University in Saudi Arabia are leading efforts to update SPECFEM3D_GLOBE to incorporate capabilities such as the simulation of higher-frequency seismic waves. The frequency of a seismic wave, measured in Hertz, is equivalent to the number of waves passing through a fixed point in one second. For instance, the current minimum frequency used in the team’s simulation is about 0.05 hertz (1 wave per 20 seconds), but Bozdag said the team would also like to incorporate seismic waves of up to 1 hertz (1 wave per second). This would allow the team to model finer details in the Earth’s mantle and even begin mapping the Earth’s core.

To make this leap, Tromp’s team is preparing for Summit, the OLCF’s next-generation supercomputer. Set to arrive in 2018, Summit will provide at least five times the computing power of Titan. As part of the OLCF’s Center for Accelerated Application Readiness, Tromp’s team is working with OLCF staff to take advantage of Summit’s computing power upon arrival.

“With Summit, we will be able to image the entire globe from crust all the way down to Earth’s center, including the core,” Bozdag said. “Our methods are expensive—we need a supercomputer to carry them out—but our results show that these expenses are justified, even necessary.”

“Global Adjoint Tomography: First-Generation Model,” Ebru Bozdag, Daniel Peter, Matthieu Lefebvre, Dimitri Komatitsch, Jeroen Tromp, Judith Hill, Norbert Podhorszki, and David Pugmire,  Geophysical Journal International 207, no. 3 (2016): 1739–1766.

This article appears courtesy of Oak Ridge National Laboratory. See the original article.

Oak Ridge National Laboratory is supported by the US Department of Energy’s Office of Science. The single largest supporter of basic research in the physical sciences in the United States, the Office of Science is working to address some of the most pressing challenges of our time. For more information, please visit science.energy.gov.

Flexibility is key in mechanism of biological self-assembly

By Catherine Zandonella, Office of the Dean for Research

A new study has modeled a crucial first step in the self-assembly of cellular structures such as drug receptors and other protein complexes, and found that the flexibility of the structures has a dramatic impact on how fast they join together.

The study, published this week in the journal Proceedings of the National Academy of Sciences, explored what happens when two water-repelling surfaces connect to build more complex structures. Using molecular simulations, researchers at Princeton University illustrated the mechanism by which the process occurs and explored factors that favor self-assembly.

A surprise finding was the sensitivity with which the surfaces’ flexibility determined the rate at which the surfaces eventually came together, with more flexible surfaces favoring joining. “Flexibility is like a knob that nature can tune to control the self-assembly of molecules,” said Pablo Debenedetti, senior author on the study and Princeton’s Dean for Research. Debenedetti is the Class of 1950 Professor in Engineering and Applied Science and a professor of chemical and biological engineering.

Researchers have long been interested in how biological structures can self-assemble according to physical laws. Tapping the secrets of self-assembly could, for example, lead to new methods of building nanomaterials for future electronic devices. Self-assembled protein complexes are the basis not only of drug receptors but also many other cellular structures, including ion channels that facilitate the transmission of signals in the brain.

The study illustrated the process by which two water-repelling, or hydrophobic, structures come together. At the start of the simulation, the two surfaces were separated by a watery environment. Researchers knew from previous studies that these surfaces, due to their hydrophobic nature, will push water molecules away until only a very few water molecules remain in the gap. The evaporation of these last few molecules allows the two surfaces to snap together.

The new molecular simulation conducted at Princeton yielded a more detailed look at the mechanism behind this process. In the simulation, when the surfaces are sufficiently close to each other, their hydrophobic nature triggered fluctuations in the number of water molecules in the gap, causing the liquid water to evaporate and form bubbles on the surfaces. The bubbles grew as more water molecules evaporated. Eventually two bubbles on either surface connected to form a gap-spanning tube, which expanded and pushed away any remaining water until the two surfaces collided.

Biological surfaces, such as cellular membranes, are flexible, so the researchers explored how the surfaces’ flexibility affected the process. The researchers tuned the flexibility of the surfaces by varying the strength of the coupling between the surface atoms. The stronger the coupling, the less each atom can wiggle relative to its neighbors.

The researchers found that the speed at which the two surfaces snap together depended greatly on flexibility. Small changes in flexibility led to large changes in the rate at which the surfaces stuck together. For example, two very flexible surfaces adhered in just nanoseconds, whereas two inflexible surfaces fused incredibly slowly, on the order of seconds.

Another finding was that the last step in the process, where the vapor tube expands, was critical for ensuring that the surfaces came together. In simulations where the tube failed to expand, the surfaces never joined. Flexibility was key to ensuring that the tube expanded, the researchers found. Making the material more flexible lowered the barriers to evaporation and stabilized the vapor tube, increasing the chances that the tube would expand.

The molecular simulation provides a foundation for understanding how biological structures assemble and function, according to Elia Altabet, a graduate student in Debenedetti’s group, and first author on the study. “A deeper understanding of the formation and function of protein assemblies such as drug receptors and ion channels could inform the design of new drugs to treat diseases,” he said.

Funding for this study was provided by National Science Foundation grants CHE-1213343 and CBET-1263565. Computations were performed at the Terascale Infrastructure for Groundbreaking Research in Engineering and Science (TIGRESS) at Princeton University.

The study, “Effect of material flexibility on the thermodynamics and kinetics of hydrophobically induced evaporation of water,” by Y. Elia Altabet, Amir Haji-Akbari and Pablo Debenedetti, was published online in the journal Proceedings of the National Academy of Sciences the week of March 13, 2017. doi: 10.1073/pnas.1620335114

Deep-sea corals reveal why atmospheric carbon was lower during the ice ages

Deep sea corals reveal that efficient nutrient consumption by plankton drove carbon sequestration in the deep ocean during the ice ages. Photo courtesy of Caltech.

By Robert Perkins, Caltech

We know a lot about how carbon dioxide (CO2) levels can drive climate change, but how about the way that climate change can cause fluctuations in CO2 levels? New research from an international team of scientists reveals one of the mechanisms by which a colder climate was accompanied by depleted atmospheric CO2 during past ice ages.

The overall goal of the work is to better understand how and why the earth goes through periodic climate change, which could shed light on how man-made factors could affect the global climate.

Now, an international team of scientists has shown that periods of colder climates are associated with higher phytoplankton efficiency and a reduction in nutrients in the surface of the Southern Ocean (the ocean surrounding the Antarctic), which is related to an increase in carbon sequestration in the deep ocean. A paper about their research appears this week in the online edition of the Proceedings of the National Academy of Sciences.

“It is critical to understand why atmospheric CO2 concentration was lower during the ice ages. This will help us understand how the ocean will respond to ongoing anthropogenic CO2 emissions,” says Xingchen (Tony) Wang, lead author of the study. Wang was a graduate student at Princeton University while conducting the research in the lab of Daniel Sigman, the Dusenbury Professor of Geological and Geophysical Sciences. Wang is now a Simons Foundation Postdoctoral Fellow on the Origins of Life at Caltech. The study used a library of 10,000 deep-sea corals collected by Caltech’s Jess Adkins.

Xingchen (Tony) Wang and Jess Adkins. Photo courtesy of Caltech

Earth’s average temperature has naturally fluctuated by about 4 to 5 degrees Celsius over the course of the past million years as the planet has cycled in and out of glacial periods. During that time, the earth’s atmospheric CO2 levels have fluctuated between roughly 180 and 280 parts per million (ppm) every 100,000 years or so. (In recent years, man-made carbon emissions have boosted that concentration up to over 400 ppm.)

About 10 years ago, researchers noticed a close correspondence between the fluctuations in CO2 levels and in temperature over the last million years. When the earth is at its coldest, the amount of CO2 in the atmosphere is also at its lowest. During the most recent ice age, which ended about 11,000 years ago, global temperatures were 5 degrees Celsius lower than they are today, and atmospheric CO2 concentrations were at 180 ppm.

There is 60 times more carbon in the ocean than in the atmosphere—partly because the ocean is so big. The mass of the world’s oceans is roughly 270 times greater than that of the atmosphere. As such, the ocean is the greatest regulator of carbon in the atmosphere, acting as both a sink and a source for atmospheric CO2.

Biological processes are the main driver of CO2 absorption from the atmosphere to the ocean. Just like photosynthesizing trees and plants on land, plankton at the surface of the sea turn CO2 into sugars that are eventually consumed by other creatures. As the sea creatures who consume those sugars—and the carbon they contain—die, they sink to the deep ocean, where the carbon is locked away from the atmosphere for a long time. This process is called the “biological pump.”

A healthy population of phytoplankton helps lock away carbon from the atmosphere. In order to thrive, phytoplankton need nutrients—notably, nitrogen, phosphorus, and iron. In most parts of the modern ocean, phytoplankton deplete all of the available nutrients in the surface ocean, and the biological pump operates at maximum efficiency.

However, in the modern Southern Ocean, there is a limited amount of iron—which means that there are not enough phytoplankton to fully consume the nitrogen and phosphorus in the surface waters. When there is less living biomass, there is also less that can die and sink to the bottom—which results in a decrease in carbon sequestration. The biological pump is not currently operating as efficiently as it theoretically could.

To track the efficiency of the biological pump over the span of the past 40,000 years, Adkins and his colleagues collected more than 10,000 fossils of the coral Desmophyllum dianthus.

Why coral? Two reasons: first, as it grows, coral accretes a skeleton around itself, precipitating calcium carbonate (CaCO3) and other trace elements (including nitrogen) out of the water around it. That process creates a rocky record of the chemistry of the ocean. Second, coral can be precisely dated using a combination of radiocarbon and uranium dating.

“Finding a few centimeter-tall fossil corals 2,000 meters deep in the ocean is no trivial task,” says Adkins, the Smits Family Professor of Geochemistry and Global Environmental Science at Caltech.

Adkins and his colleagues collected coral from the relatively narrow (500-mile) gap known as the Drake Passage between South America and Antarctica (among other places). Because the Southern Ocean flows around Antarctica, all of its waters funnel through that gap—making the samples Adkins collected a robust record of the water throughout the Southern Ocean.

Coauthors include scientists from Caltech, Princeton University, Pomona College, the Max Planck Institute for Chemistry in Germany, University of Bristol, and ETH Zurich in Switzerland.

Wang analyzed the ratios of two isotopes of nitrogen atoms in these corals – nitrogen-14 (14N, the most common variety of the atom, with seven protons and seven neutrons in its nucleus) and nitrogen-15 (15N, which has an extra neutron). When phytoplankton consume nitrogen, they prefer 14N to 15N. As a result, there is a correlation between the ratio of nitrogen isotopes in sinking organic matter (which the corals then eat as it falls to the seafloor) and how much nitrogen is being consumed in the surface ocean—and, by extension, the efficiency of the biological pump.

A higher amount of 15N in the fossils indicates that the biological pump was operating more efficiently at that time. An analogy would be monitoring what a person eats in their home. If they are eating more of their less-liked foods, then one could assume that the amount of food in their pantry is running low.

Indeed, Wang found that higher amounts of 15N were present in fossils corresponding to the last ice age, indicating that the biological pump was operating more efficiently during that time. As such, the evidence suggests that colder climates allow more biomass to grow in the surface Southern Ocean—likely because colder climates experience stronger winds, which can blow more iron into the Southern Ocean from the continents. That biomass consumes carbon, then dies and sinks, locking it away from the atmosphere.

Adkins and his colleagues plan to continue probing the coral library for further details about the cycles of ocean chemistry changes over the past several hundred thousand years.

The research was funded by the National Science Foundation, Princeton University, the European Research Council, and the Natural Environment Research Council.

The study, “Deep-sea coral evidence for lower Southern Ocean surface nitrate concentrations during the last ice age,” Xingchen Tony Wang, Daniel M. Sigman, Maria G. Prokopenko, Jess F. Adkins, Laura F. Robinson, Sophia K. Hines, Junyi Chai, Anja S. Studer, Alfredo Martínez-García, Tianyu Chen, and Gerald H. Haug, was published in the journal Proceedings of the National Academy of Sciences early edition the week of March 13, 2017. doi: 10.1073/pnas.1615718114

Article provided courtesy of Caltech

Researchers develop technique to track yellow fever virus replication

Infection with a strain of yellow fever virus
Infection with a strain of yellow fever virus (YFD-17D) in mouse liver. The liver of a mouse whose immune cells lack the immune signaling component known as STAT1 shows severe lymphocyte infiltration and inflammation, as well as necrosis, after infection with YFV-17D. Credit: Florian Douam and Alexander Ploss

By Staff, Department of Molecular Biology

Researchers from Princeton University‘s Department of Molecular Biology have developed a new method that can precisely track the replication of yellow fever virus in individual host immune cells. The technique, which is described in a paper published March 14 in the journal Nature Communications, could aid the development of new vaccines against a range of viruses, including Dengue and Zika.

Yellow fever virus (YFV) is a member of the flavivirus family that also includes Dengue and Zika virus. The virus, which is thought to infect a variety of cell types in the body, causes up to 200,000 cases of yellow fever every year, despite the widespread use of a highly effective vaccine. The vaccine consists of a live, attenuated form of the virus called YFV-17D, whose RNA genome is more than 99 percent identical to the virulent strain. This one percent difference in the attenuated virus’ genome may subtly alter interactions with the host immune system so that it induces a protective immune response without causing disease.

To explore how viruses interact with their hosts, and how these processes lead to virulence and disease, Alexander Ploss, assistant professor of molecular biology, and colleagues at Princeton University adapted a technique — called RNA Prime flow — that can detect RNA molecules within individual cells. They used the technique to track the presence of replicating viral particles in various immune cells circulating in the blood of infected mice. Mice are usually resistant to YFV, but Ploss and colleagues found that even the attenuated YFV-17D strain was lethal if the transcription factor STAT1, part of the antiviral interferon signaling pathway, was removed from mouse immune cells. The finding suggests that interferon signaling within immune cells protects mice from YFV, and that species-specific differences in this pathway allow the virus to replicate in humans and certain other primates but not mice.

Accordingly, YFV-17D was able to replicate efficiently in mice whose immune systems had been replaced with human immune cells capable of activating interferon signaling. However, just like humans immunized with the attenuated YFV vaccine, these “humanized” mice didn’t develop disease symptoms when infected with YFV-17D, allowing Ploss and colleagues to study how the attenuated virus interacts with the human immune system. Using their viral RNA flow technique, the researchers determined that the virus can replicate inside certain human immune cell types, including B lymphocytes and natural killer cells, in which the virus has not been detected previously. The researchers found that the panel of human cell types targeted by the virus changes over the course of infection in both the blood and the spleen of the animals, highlighting the distinct dynamics of YFV-17D replication in the human immune system.

The next step, said Florian Douam, a postdoctoral research associate in the Department of Molecular Biology and first author on the study, is to confirm YFV replication in these subsets of immune cells in YFV-infected patients and in recipients of the YFV-17D vaccine. Viral RNA flow now provides the means to perform such analyses, Douam said.

The researchers also plan to study whether the virulent and attenuated strains of yellow fever virus infect different host immune cells. The approach may help explain why some people infected with the virus die while others develop only the mildest of symptoms, as well as which changes in the YFV-17D genome weaken the virus’ ability to cause disease. “This could guide the rational design of vaccines against related pathogens, such as Zika and Dengue virus,” Ploss said.

This work was supported by a grant from the Health Grand Challenge program from Princeton University, the New Jersey Commission on Cancer Research (Grant No. DHFS16PPC007), the Genentech Foundation and Princeton University’s Anthony Evnin ’62 Senior Thesis Fund.

Florian Douam, Gabriela Hrebikova, Yentli E. Soto Albrecht, Julie Sellau, Yael Sharon, Qiang Ding and Alexander Ploss. Single-cell tracking of flavivirus RNA uncovers species-specific interactions with the immune system dictating disease outcome. Nature Communications. 8: 14781. (2017). doi: 10.1038/ncomms14781