The notorious Luminous Blue Variable star

purple orange blue star changing over time

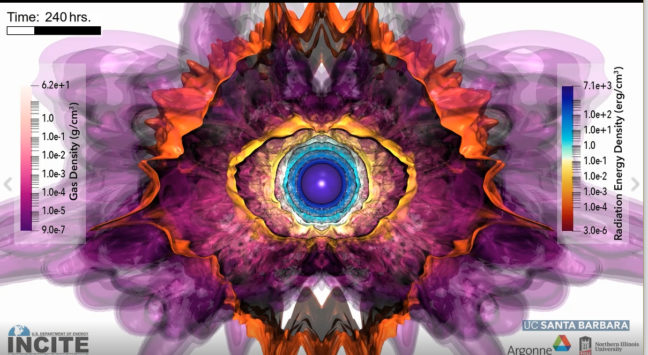
New, three-dimensional simulations reveal the inner workings of one of the universe’s most mysterious stars.

Sparkling with an exceptional blue-toned brilliance and exhibiting wild variations in both brightness and spectrum, the luminous blue variable (LBV) is a relatively rare and still somewhat mysterious type of star.

Video courtesy of the University of California-Santa Barbara

Its appearance tends to fluctuate radically over time, and that has piqued the curiosity of astrophysicists who wonder what processes may be at play.

“The luminous blue variable is a supermassive, unstable star,” said Yan-Fei Jiang, a researcher at the University of California-Santa Barbara’s Kavli Institute for Theoretical Physics (KITP) who earned his doctorate at Princeton University in 2013.

Jiang is the first author on a new study published in the journal Nature this week. The paper’s senior author is Princeton’s James Stone, the Lyman Spitzer Jr., Professor of Theoretical Astrophysics, Stone, a professor of astrophysical sciences and applied and computational mathematics, and the chair of Princeton’s Department of Astrophysical Sciences. Jiang and Stone developed the numerical code used in the study.

Unlike our own comparatively smaller and steady-burning Sun, LBVs have been shown to burn bright and hot, then cool and fade so as to be almost indistinguishable from other stars, only to flare up again. Because of these changes, conventional one-dimensional models have been less than adequate at explaining the special physics of these stars.

However, thanks to special, data-intensive supercomputer modeling conducted at Argonne National Laboratory’s Argonne Leadership Computing Facility (ALCF) for its INCITE program, Jiang and colleagues — Matteo Cantiello, a visiting associate research scholar in Princeton’s Department of Astrophysical Sciences, and an associate research scientist at the Simons Foundation’s Flatiron Institute; Lars Bildsten of KITP; Eliot Quataert at UC Berkeley; Omer Blaes of UCSB; and Stone of Princeton — have now developed a three-dimensional simulation. It not only shows the stages of an LBV as it becomes progressively more luminous, then erupts, but also depicts the physical forces that contribute to that behavior. The simulation was developed also with computational resources from NASA and the National Energy Research Scientific Computing Center.

Of particular interest to the researchers are the stars’ mass loss rates, which are significant compared to those of less massive stars. Understanding how these stellar bodies lose mass, Jiang said, could lead to greater insights into just how they end their lives as bright supernova.

Among the physical processes never before seen with one-dimensional models are the supersonic turbulent motions — the ripples and wrinkles radiating from the star’s deep envelope as it prepares for a series of outbursts.

“These stars can have a surface  temperature of about 9,000 degrees Kelvin during these outbursts,” Jiang said. That translates to 15,740 degrees Fahrenheit or 8,726 degrees Celsius.

Also seen for the first time in three dimensions is the tremendous expansion of the star immediately before and during the outbursts — phenomena not captured with previous one-dimensional models. The three dimensional simulations show that it is the opacity of the helium that sets the observed temperature during the outburst.

According to Jiang, in a one-dimensional stellar evolution code, helium opacity — the extent to which helium atoms prevent photons (light) from escaping — is not very important in the outer envelope because the gas density at the cooler outer envelope is far too low.

The paper’s co-author and KITP Director Lars Bildsten explained that the three-dimensional model demonstrates that “the region deep within the star has such vigorous convection that the layers above that location get pushed out to much larger radii, allowing the material at the location where helium recombines to be much denser.” The radiation escaping from the star’s hot core pushes on the cooler, opaque outer region to trigger dramatic outbursts during which the star loses large amounts mass. Hence, convection — the same phenomena responsible for thundercloud formation — causes not only variations in the star’s radius but also in the amount of mass leaving in the form of a stellar wind.

Additional work is underway on more simulations, according to Jiang, including models of the same stars but with different parameters such as metallicity, rotation and magnetic fields.

“We are trying to understand how these parameters will affect the properties of the stars,” Jiang said. “We are also working on different types of massive stars — the so-called Wolf-Rayet stars — which also show strong mass loss.”

The journal article is “Luminous Blue Variable Outbursts from the Variations of Helium Opacity,” by Yan-Fei Jiang, Matteo Cantiello, Lars Bildsten, Eliot Quataert, Omer Blaes and James Stone. Nature, September 27, 2018.

This story was provided by the University of California-Santa Barbara.

This research was supported in part by the NASA ATP grant ATP-80NSSC18K0560, the National Science Foundation under grant number NSF PHY 11-25915, 17-48958, and in part by a Simons Investigator award from the Simons Foundation (to E.Q.) and the Gordon and Betty Moore Foundation through grant GBMF5076. An award of computer time was provided by the Innovative and Novel Computational Impact on Theory and Experiment (INCITE) program. This research used resources of the Argonne Leadership Computing Facility and National Energy Research Scientific Computing Center, which are DOE Offices of Science User Facility supported under contract DE-AC02-06CH11357 and DE-AC02-05CH11231. Resources supporting this work were also provided by the NASA High-End Computing (HEC) program through the NASA Advanced Supercomputing (NAS) Division at Ames Research Center. The Flatiron Institute is supported by the Simons Foundation

A new cosmic survey offers unprecedented view of galaxies

View of the galaxies
A color composite image in the green, red and infrared bands of a patch of the sky known as the COSMOS field, as imaged by the Subaru Telescope in Hawaii. The galaxies are seen at such large distances that the light from them has taken billions of years to reach Earth. The light from the faintest galaxies in this image was emitted when the universe was less than 10 percent of its present age. Click here to pan around the image. (Credit: Princeton University/HSC Project)

By the Office of the Dean for Research

The universe has come into sharper focus with the release this week of new images from one of the largest telescopes in the world. A multinational collaboration led by the National Astronomical Observatory of Japan that includes Princeton University scientists has published a “cosmic census” of a large swath of the night sky containing roughly 100 million stars and galaxies, including some of the most distant objects in the universe. These high-quality images allow an unprecedented view into the nature and evolution of galaxies and dark matter.

The images and accompanying data were collected using a digital optical-imaging camera on the Subaru Telescope, located at the Mauna Kea Observatory in Hawaii. The camera, known as Hyper Suprime-Cam, is mounted directly in the optical path, at the “prime focus,” of the Subaru Telescope. A single image from the camera captures an amount of sky equal to the area of about nine full moons.

The project, known as the Hyper Suprime-Cam Subaru Strategic Program, is led by the National Astronomical Observatory of Japan (NAOJ) in collaboration with the Kavli Institute for the Physics and Mathematics of the Universe in Japan, the Academia Sinica Institute of Astronomy and Astrophysics in Taiwan, and Princeton University.

The release includes data from the first one-and-a-half years of the project, consisting of 61.5 nights of observations beginning in 2014. The project will take 300 nights over five to six years.

The data will allow researchers to look for previously undiscovered galaxies and to search for dark matter, which is matter that neither emits nor absorbs light but which can be detected via its effects on gravity. A 2015 study using Hyper Suprime-Cam surveyed 2.3 square degrees of sky and found gravitational signatures of nine clumps of dark matter, each weighing as much as a galaxy cluster (Miyazaki et al., 2015). The current data release covers about 50 times more sky than was used in that study, showing the potential of these data to reveal the statistical properties of dark matter.

The survey consists of three layers: a Wide survey that will eventually cover an area equal to 7000 full moons, or 1400 square degrees; a Deep survey that will look farther into the universe and encompass 26 square degrees; and an UltraDeep survey that will cover 3.5 square degrees and penetrate deep into space, allowing observations of some of the most distant galaxies in the universe. The surveys use optical and near infrared wavelengths in five broad wavelength bands (green, red, infrared, z, and y) and four narrow-band filters. In the multi-band images, the images are extremely sharp, with star images only 0.6 to 0.8 arcseconds across. (One arcsecond equals 3600th part of a degree.)

Figure 2: Cluster of galaxies
An image of a massive cluster of galaxies in the Virgo constellation showing numerous strong gravitational lenses. The distance to the central galaxy is 5.3 billion light years, while the lensed galaxies, apparent as the arcs around the cluster, are much more distant. This is a composite image in the green, red, and infrared band, and has a spatial resolution of about 0.6 arcsecond. (Credit: NAOJ/HSC Project)

The ability to capture images from deep in space is made possible by the light-collection power of the Subaru Telescope’s mirror, which has an aperture of 8.2 meters, as well as the image exposure time. The depth into space that one can look is measured in terms of the magnitude, or brightness of objects that can be seen from Earth in a given wavelength band. The depths of the three surveys are characterized by magnitudes in the red band of 26.4, 26.6 and 27.3 in the Wide, Deep and Ultradeep data, respectively. As the survey continues, the Deep and Ultradeep surveys will be able to image fainter objects.

The Hyper Suprime-Cam contains 104 scientific charge-coupled devices (CCDs) for a total of 870 million pixels. The total amount of data taken so far comprises 80 terabytes, which is comparable to the size of about 10 million images by a typical digital camera, and covers 108 square degrees. Because it is difficult to search such a huge dataset with standard tools, NAOJ has developed a dedicated database and interface for ease of access and use of the data.

Figure 3: Interation between galaxies
A color composite image in the green, red and infrared bands of UGC 10214, known as the Tadpole Galaxy in the ELAIS-N1 region. The distance to this galaxy is about 400 million light years. The long tail of stars is due to gravitational interaction between two galaxies. (Credit: NAOJ/HSC Project)

“Since 2014, we have been observing the sky with HSC, which can capture a wide-field image with high resolution,” said Satoshi Miyazaki, the leader of the project and a scientist at NAOJ. “We believe the data release will lead to many exciting astronomical results, from exploring the nature of dark matter and dark energy, as well as asteroids in our own solar system and galaxies in the early universe. The team members are now preparing a number of scientific papers based on these data. We plan to publish them in a special issue of the Publication of Astronomical Society of Japan. Moreover, we hope that interested members of the public will also access the data and enjoy the real universe imaged by the Subaru telescope, one of the largest the world.”

At Princeton, the project is co-led by Michael Strauss and Robert Lupton of the Department of Astrophysical Sciences. “The HSC data are really beautiful,” Strauss said. “Princeton scientists are using these data to explore the nature of merging galaxies, to search for the most distant quasars in the universe, to map the outer reaches of the Milky Way Galaxy, and for many other projects. We are delighted to make these wonderful images available to the world-wide astronomical community.”

Funding for the HSC Project was provided in part by the following grants: Grant-in-Aid for Scientific Research (B) JP15340065; Grant-in-Aid for Scientific Research on Priority Areas JP18072003; and the Funding Program for World-Leading Innovative R&D on Science and Technology (FIRST) entitled, “Uncovering the origin and future of the Universe-ultra-wide-field imaging and spectroscopy reveal the nature of dark matter and dark energy.” Funding was also provided by Princeton University.

This article was adapted from a press release from the National Astronomical Observatory of Japan.

Beautiful but strange: The dark side of cosmology (Science)

By Catherine Zandonella, Office of the Dean for Research

It’s a beautiful theory: the standard model of cosmology describes the universe using just six parameters. But it is also strange. The model predicts that dark matter and dark energy – two mysterious entities that have never been detected — make up 95% of the universe, leaving only 5% composed of the ordinary matter so essential to our existence.

In an article in this week’s Science, Princeton astrophysicist David Spergel reviews how cosmologists came to be certain that we are surrounded by matter and energy that we cannot see. Observations of galaxies, supernovae, and the universe’s temperature, among other things, have led researchers to conclude that the universe is mostly uniform and flat, but is expanding due to a puzzling phenomenon called dark energy. The rate of expansion is increasing over time, counteracting the attractive force of gravity. This last observation, says Spergel, implies that if you throw a ball upward you will see it start to accelerate away from you.

The components of our universe
The components of our universe. Dark energy comprises 69% of the mass energy density of the universe, dark matter comprises 25%, and “ordinary” atomic matter makes up 5%. Three types of neutrinos make up at least 0.1%, the cosmic background radiation makes up 0.01%, and black holes comprise at least 0.005%. (Source: Science/AAAS)

A number of experiments to detect dark matter and dark energy are underway, and some researchers have already claimed to have found particles of dark matter, although the results are controversial. New findings expected in the coming years from the Large Hadron Collider, the world’s most powerful particle accelerator, could provide evidence for a proposed theory, supersymmetry, that could explain the dark particles.

But explaining dark energy, and why the universe is accelerating, is a tougher problem. Over the next decade, powerful telescopes will come online to map the structure of the universe and trace the distribution of matter over the past 10 billion years, providing new insights into the source of cosmic acceleration.

Yet observations alone are probably not enough, according to Spergel. A full understanding will require new ideas in physics, perhaps even a new theory of gravity, possibly including extra dimensions, Spergel writes. “We will likely need a new idea as profound as general relativity to explain these mysteries.”

When that happens, our understanding of the dark side of cosmology will no longer accelerate away from us.

Read the article

Citation: Spergel, David. The dark side of cosmology: Dark matter and dark energy. Science, 6 March 2015: Vol. 347 no. 6226 pp. 1100-1102 DOI: 10.1126/science.aaa0980.

–David Spergel is the Charles A. Young Professor of Astronomy on the Class of 1897 Foundation, a professor of astrophysical sciences, and chair of Princeton’s Department of Astrophysical Sciences. His research is supported by the National Science Foundation and NASA.