
a) Group number and name
Group 6 – GARP
b) Group first names and roles
Gene, Alice, Rodrigo, Phil
Team Member Roles:
Gene – Editor, D.J.
Alice – Writer, Punmaster
Rodrigo – Idea man/Photographer
Phil – Artiste/Builder
c) Mission Statement
Runners frequently get injuries. Some of these injuries could be fixed or prevented by proper gait and form. The problem is how to test a person’s running form and gait. Current tools for gait analysis do not provide a holistic picture of the user’s gait. Insole pressure sensors fail to account for other biomechanical factors, such as leg length differences and posture. While running, users have very little access to data — they are entirely dependent on their own perception of their form while running. This perception can be rather inaccurate, especially if the runner is fatigued. We will build a system that solves these problems while causing minimal alteration to natural running movements. We hope to develop our plans for sensor placement, location of wearable components, and data visualization. We hope to discover whether or not people think this has enough or too many components. We will evaluate our product for comfort based on the intended size, weight, and shape. We will evaluate the effectiveness of depictions of the recorded data. Our mission is to build a low-impact gait-analysis system that generates a more meaningful representation of data than the existing systems. These metrics will facilitate sports medicine and the process of buying specialized athletic footware.
d) Prototype Description
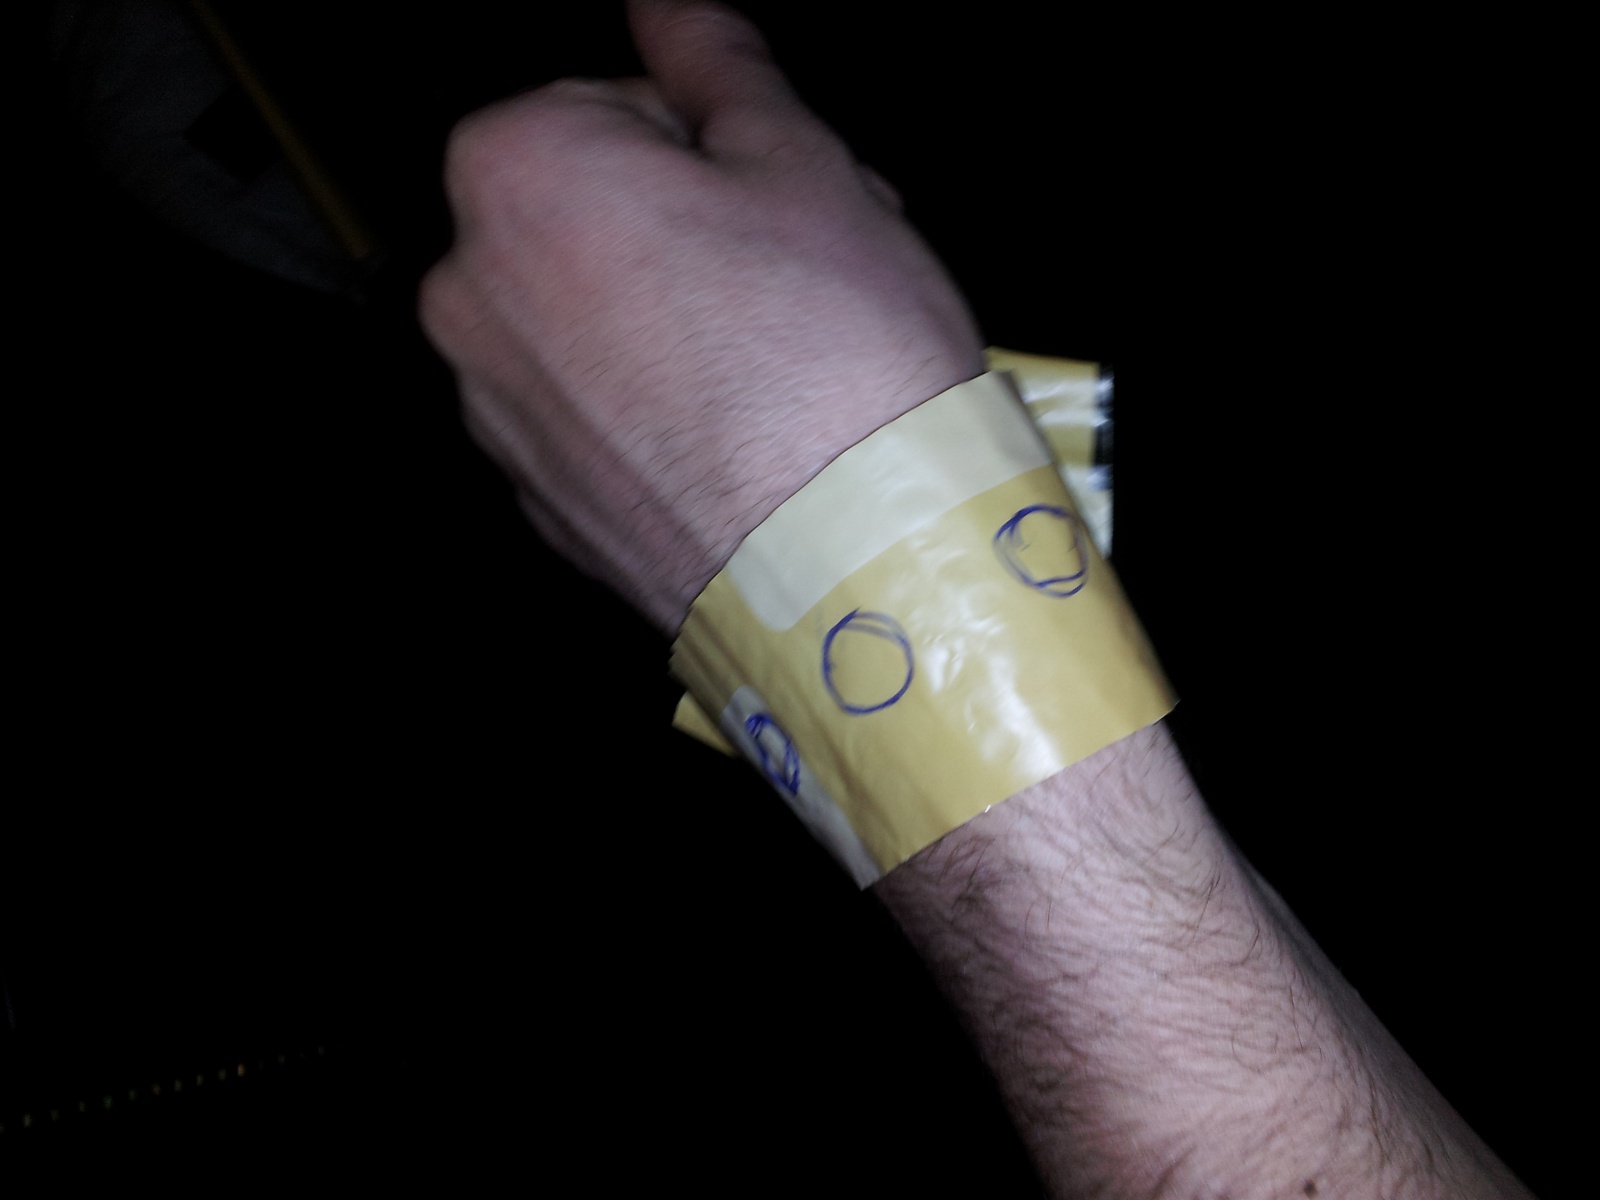
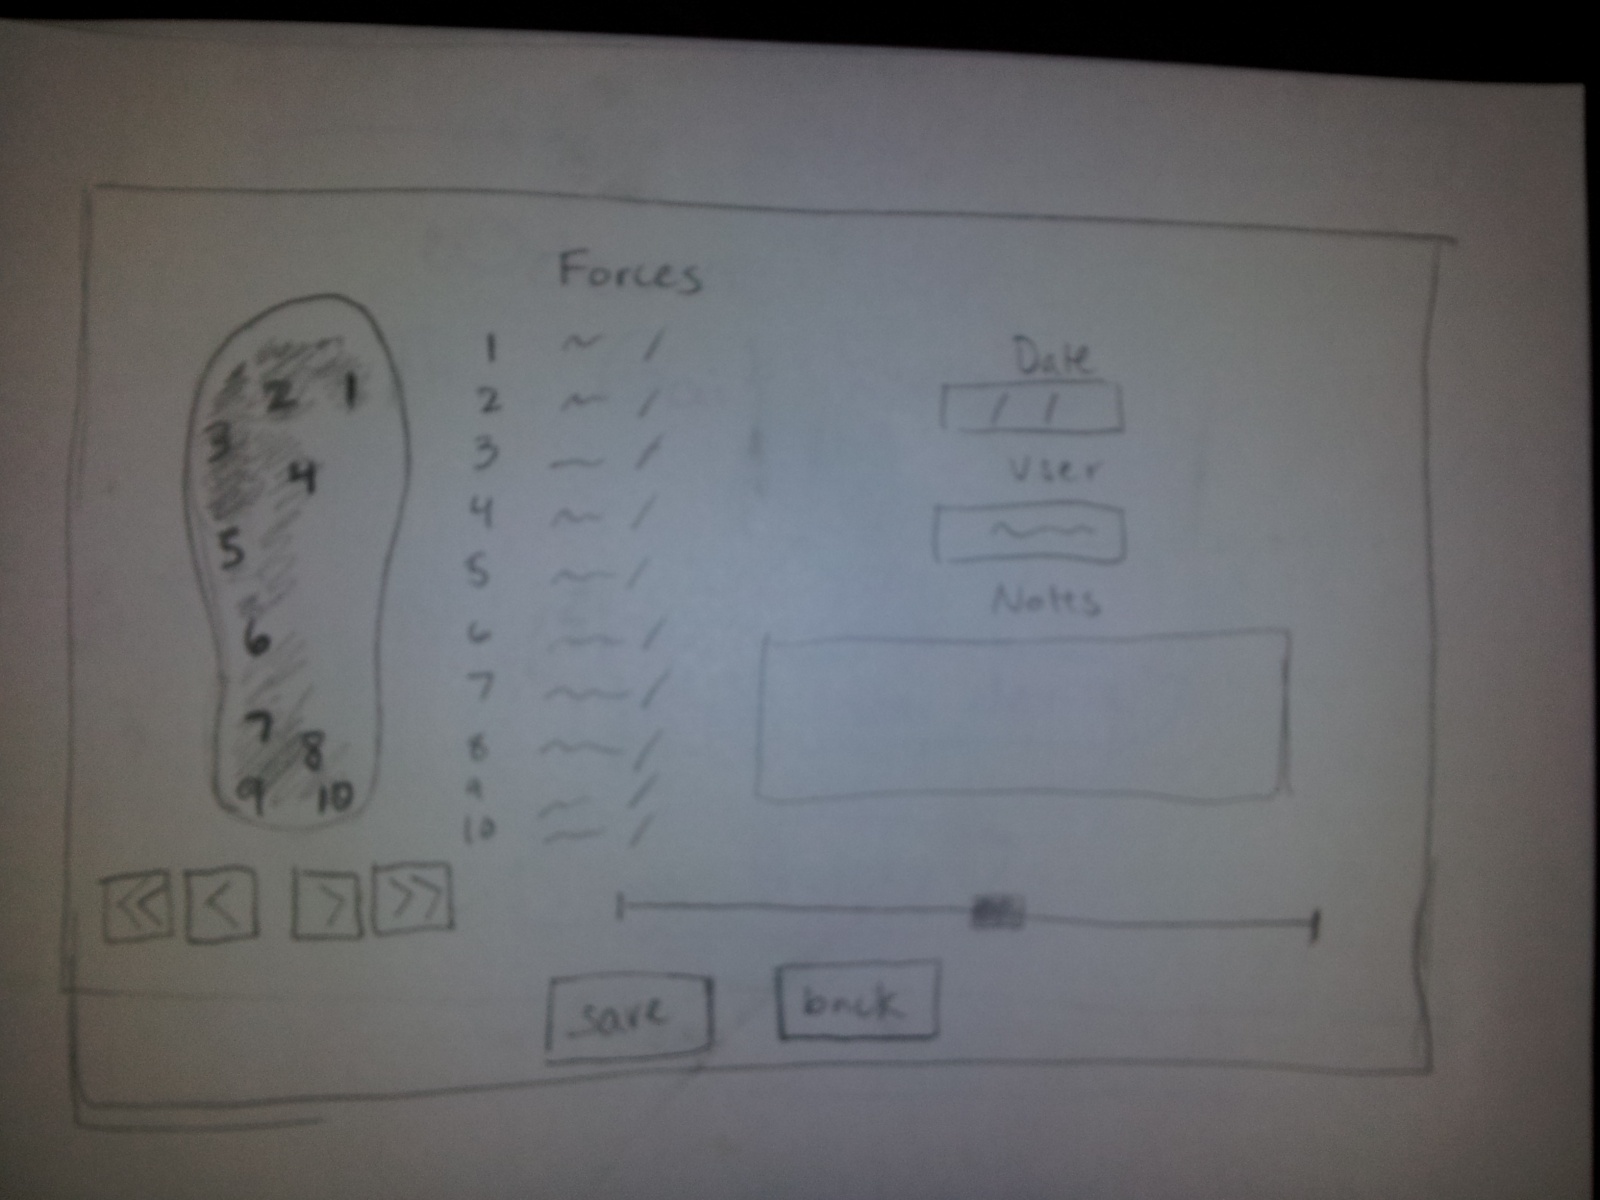
We implemented a basic version of the foot sensor, the ankle device, the wrist display, and the screens for the computer once the device has been hooked up. The foot sensor is made out of cardboard and is about the size and thickness that our insert will be. We drew on top the general layout of where the sensors will likely be. The ankle device is made out of foam, some weights, and material from a bubble wrap envelope as the strap.The foam and weights were used to create a similar sized and feeling device to an arduino with a battery pack and accelerometer.The wrist display is just three circles drawn onto a strap, again made from bubble wrap envelope. The circles represent LEDs that will light up to indicate correct, so-so, and bad gait (tentatively chosen as green, yellow, and red). For the screens we have mapped out a welcome screen which can take you to either load new data or view past analyses. Selecting to load new data will first take you to a waiting screen. Once the device is connected, the listed device status will change to connected and the progress bar will begin to fill. From there it will go to the page that displays the analysis tools. We have depicted a heat map image of the foot showing the pressure, and information about each sensor, the runner, the data, and any additional notes the user wants to input. Selecting history from the welcome screen will take you to a page with a list of users. You can either scroll through them or select the top text bar to type in a name to narrow down the results. Clicking on a user will open a drop down menu for dates, selecting a date will take you to the analysis from that day, which is basically the same page as the one you go to after loading new data, but will load any previously made notes or user input.
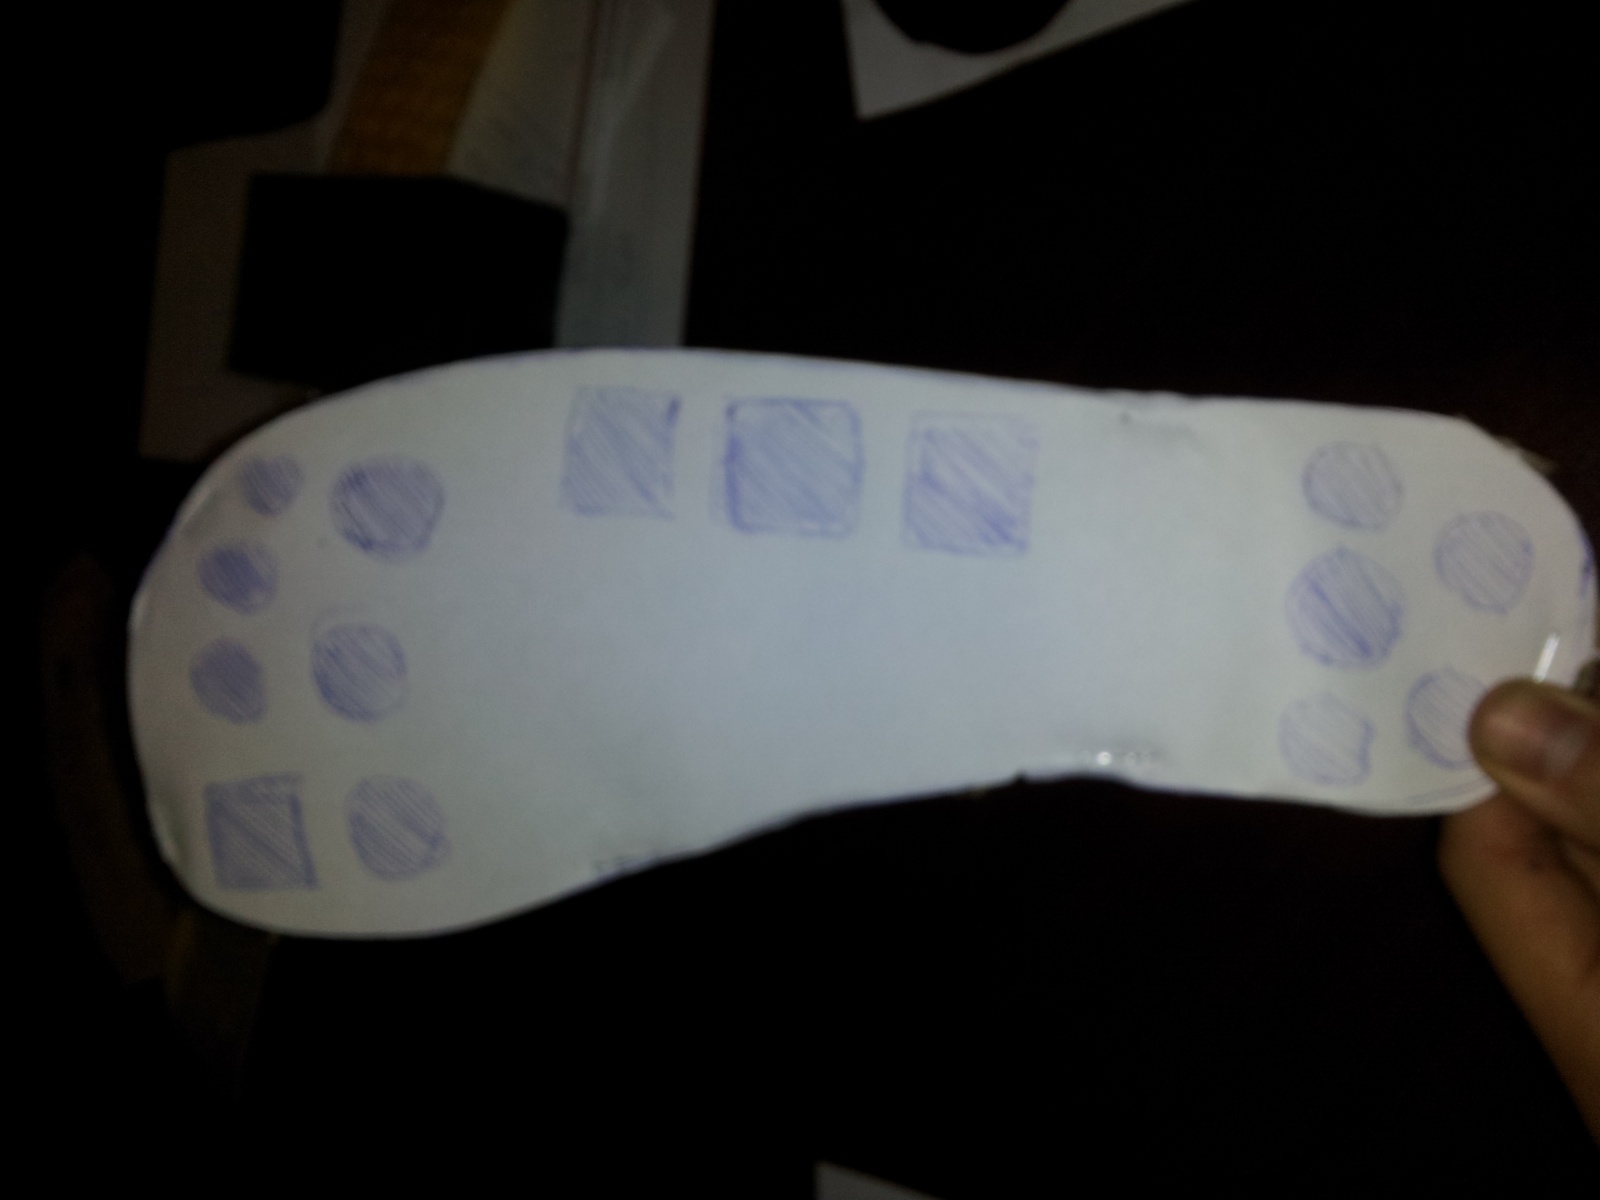
The foot pad for GaitKeeper
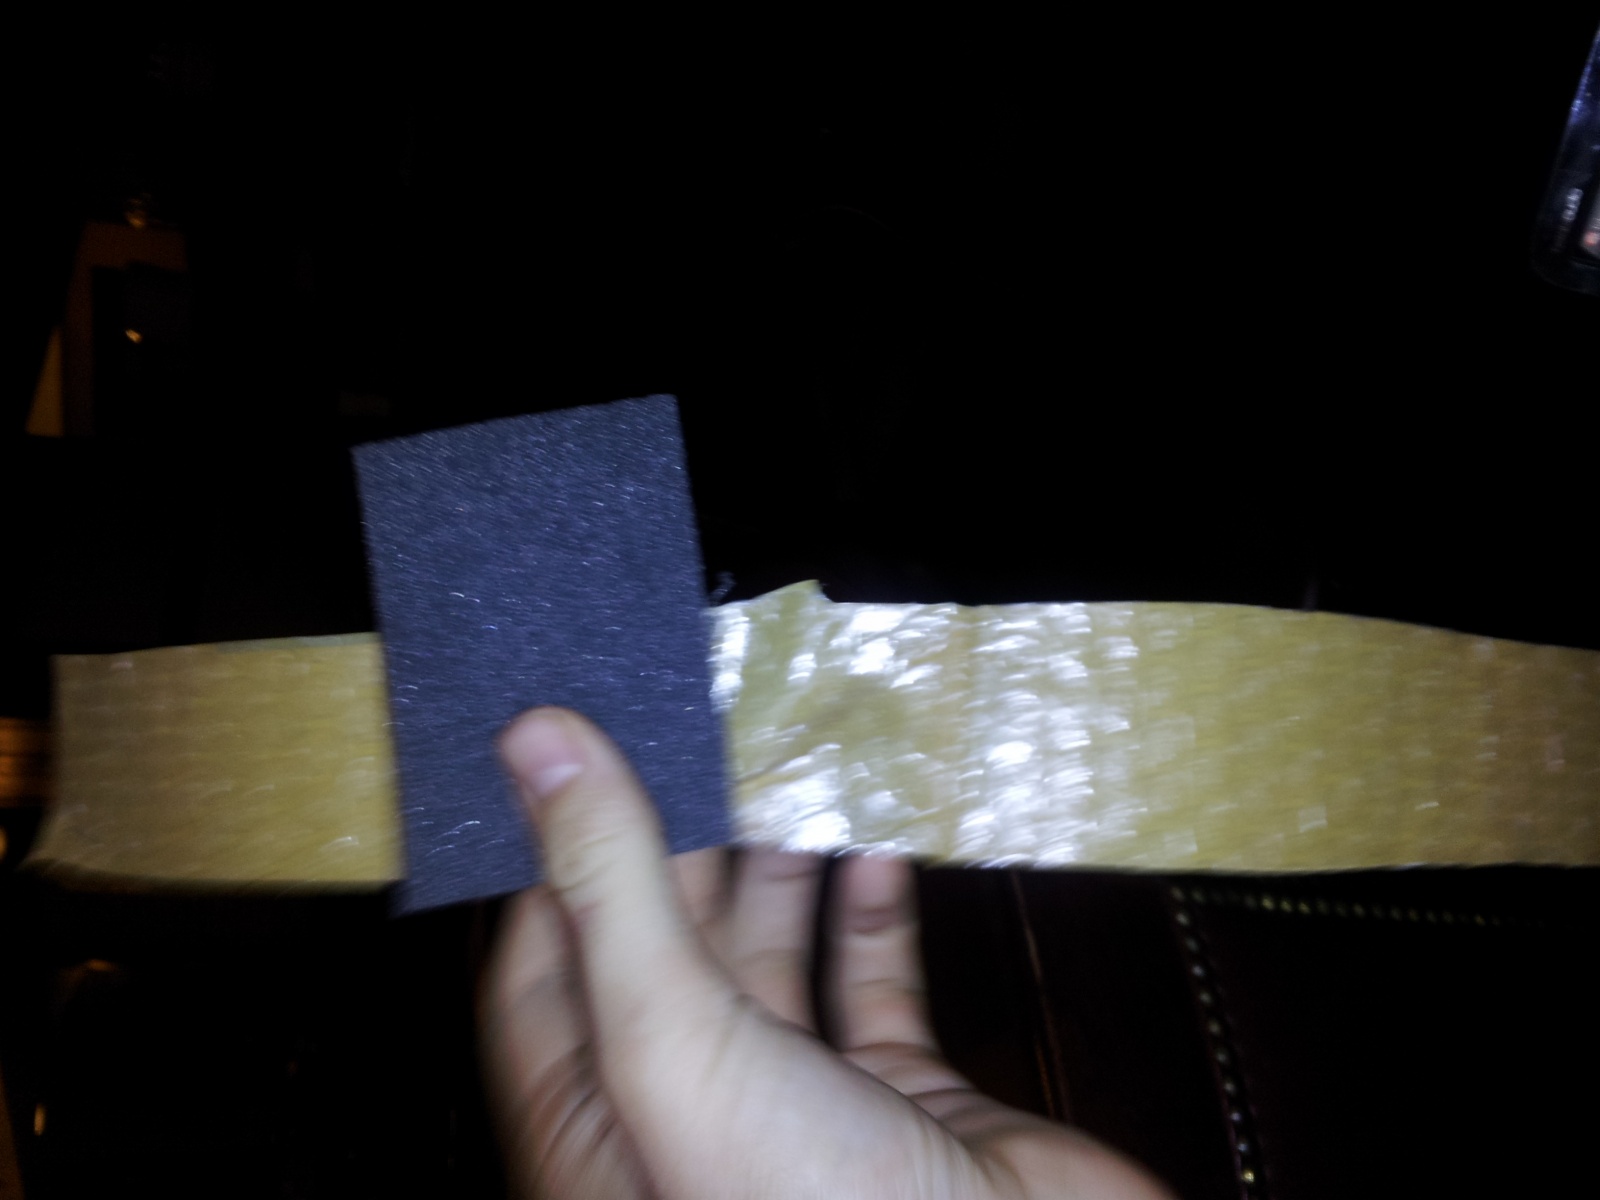
The ankle holder for our prototype.
e) Prototype Testing Tasks
TASK 1: While running, assess gait and technique.
The motivating story for this test is the story of a runner who is worried that their form while running is unhealthy, placing them in danger of injuring themselves.
We will have the athlete install the system on themselves to determine the intuitiveness of placement of the various components. To facilitate testing, the subject will run on a treadmill. One member of our group will perform real-time gait analysis of our subject based on the evaluator’s personal running experiences. Another member will change the color of the simulated LED accordingly. The group member in charge of gait analysis will observe the runner for gait alterations. We will weigh the prototype components to the approximate weight of each component, and observe the prototype’s stability and attachment during running. Also, we will interview the user about the comfort of the system.

The athlete puts the foot pad in their shoe
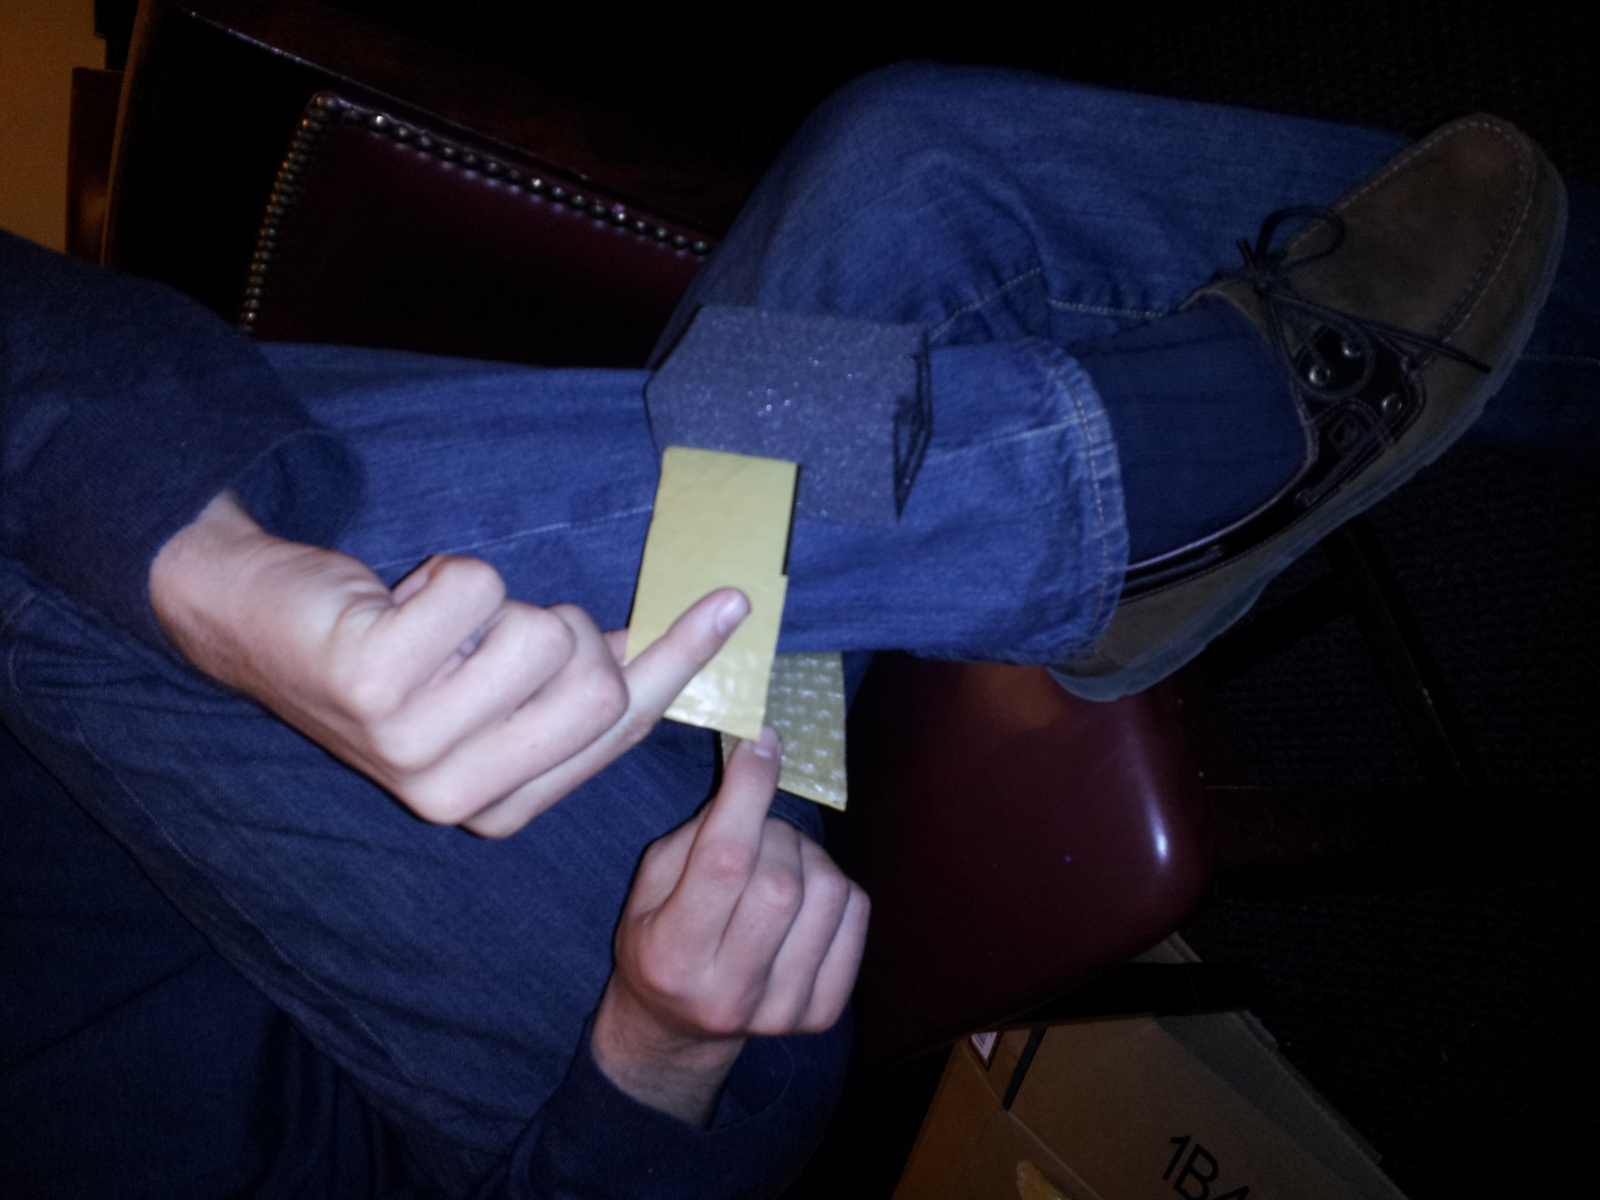
The athlete straps the prototype on their ankle
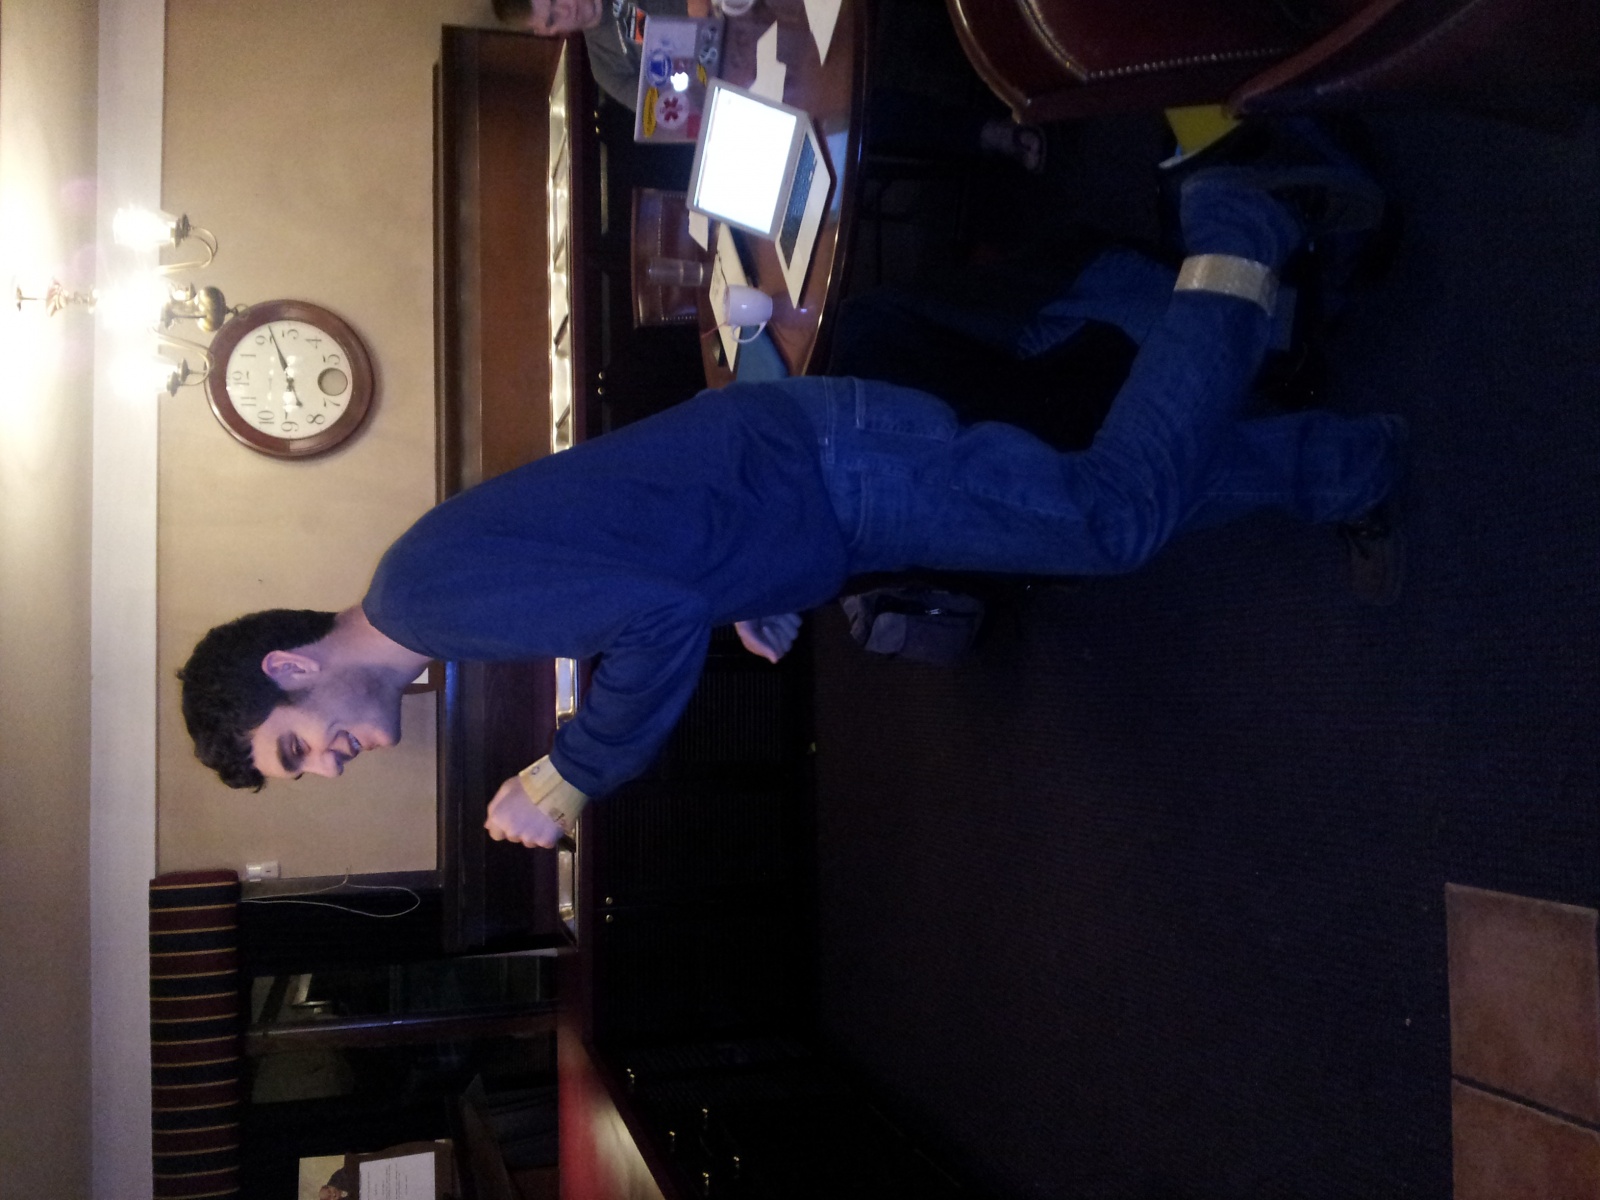
The athlete runs on the treadmill
During the workout, the LEDs change color depending on the health of the gait
TASK 2: After an injury, evaluate what elements of gait can be changed in order to prevent recurrence.
The motivating story for this test is the story of a runner who has injured themselves while running. The injury may or may not be gait-related. They are working with a specialist in biomechanics and/or orthopedic medicine to alter their gait to reduce the chance of exacerbating the injury or re-injuring themselves.
We will attempt to find a runner with a current injury, and interview them about the nature of their injury ahead of time. Specialists in biomechanics have extensive demands on their time, so one group member will play that role instead, including brief research into prevention of the injury in question. After assisting the runner in placing and securing the system, we will have the runner run on a treadmill. After the run, we will simulate plugging the device into the computer, and will show simulated running data.

After the workout, the device is plugged into a computer.
The data is shown and aspects of the gait can be identified. Using the data, the doctor can see whether the gait has unhealthy characteristics and can suggest exercises that would help improve the gait for the athlete.
TASK 3: When buying running shoes, determine what sort of shoe is most compatible with your running style.
The motivating story for this test is the story of a customer who is going to a running store and looking for the perfect shoe for their gait. Even if the store allows the user to test the shoe on a treadmill in the store, it is difficult to find the right shoe from feel alone (we know this from personal experience after a team member bought a shoe in P2). A quantitative process would be less error-prone and would allow the in-store specialists to give more substantial advice to customers.

The shoe pad fits into various shoe models of the same size

A gait window for each shoe is opened on a computer in front of the treadmill. The user can see the results of the sensors as they run and the specialist, by the treadmill, can see it as well.
f) Prototype Discussion
i. How did you make it?
The prototype was constructed from found and brought materials in an ad-hoc manner. We worked to simulate the weight and feel of the actual system.
ii. Did you come up with any new prototyping techniques to make something more suitable for your assignment than straight-up paper?
Yes. Our prototype involves fewer interface screens than the projects we contemplated for the individual paper prototyping assignment. We used materials in a three-dimensional manner to model how they will fit on the body of the user.
iii. What was difficult?
It was difficult coming up with names for buttons and functions that would be intuitive for a user.
Building a simulation of physical objects is difficult because the feel of the objects is more important than the visual appearance. We couldn’t think about this physical shape and feel prototyping the same way we did about the paper prototyping we did for the individual assignment.
It was also difficult to determine the layout of the screens. Specifically, designing the main analysis screen was a challenge because we wanted it to be as informative as possible without being cluttered. This is clearly a central challenge of all data analysis tools, as it required us to really consider our distinct user groups and how each of them will interact with the data differently. After a good deal of discussion, we decided that it would be effective to have a single desktop interface that all user groups interact with. Our main concern here was that runners might be overwhelmed by the information that doctors or running company employees would want to see for their analysis. However, we concluded from our previous interviews that the running users who would use this product would probably be relatively well informed, almost to the level of running store employees.
iv. What worked well?
We let group members who were immediately excited about prototyping and began building components without prompting continue with prototyping for the duration of the assignment. This produced prototyping material quickly, and let good ideas flow.
By connecting the intended uses of the tasks together, we were able to make an interface that addresses the multiple needs of each task simultaneously. This simplified our product and allowed us to make it more understandable and applicable to use cases we weren’t even thinking about.
The design of the physical device was also a success, as we found through testing that it did not significantly affect how we ran. The weights added, which we made comparable to an Arduino with batteries, were not excessive. The form factor was also acceptable, even in a context with a good deal of movement.