
Group Members:
Brian Matejek
Joshua Prager
Matt Dolan
Ed Kelley
Group Number: 20
Photo Sketches:
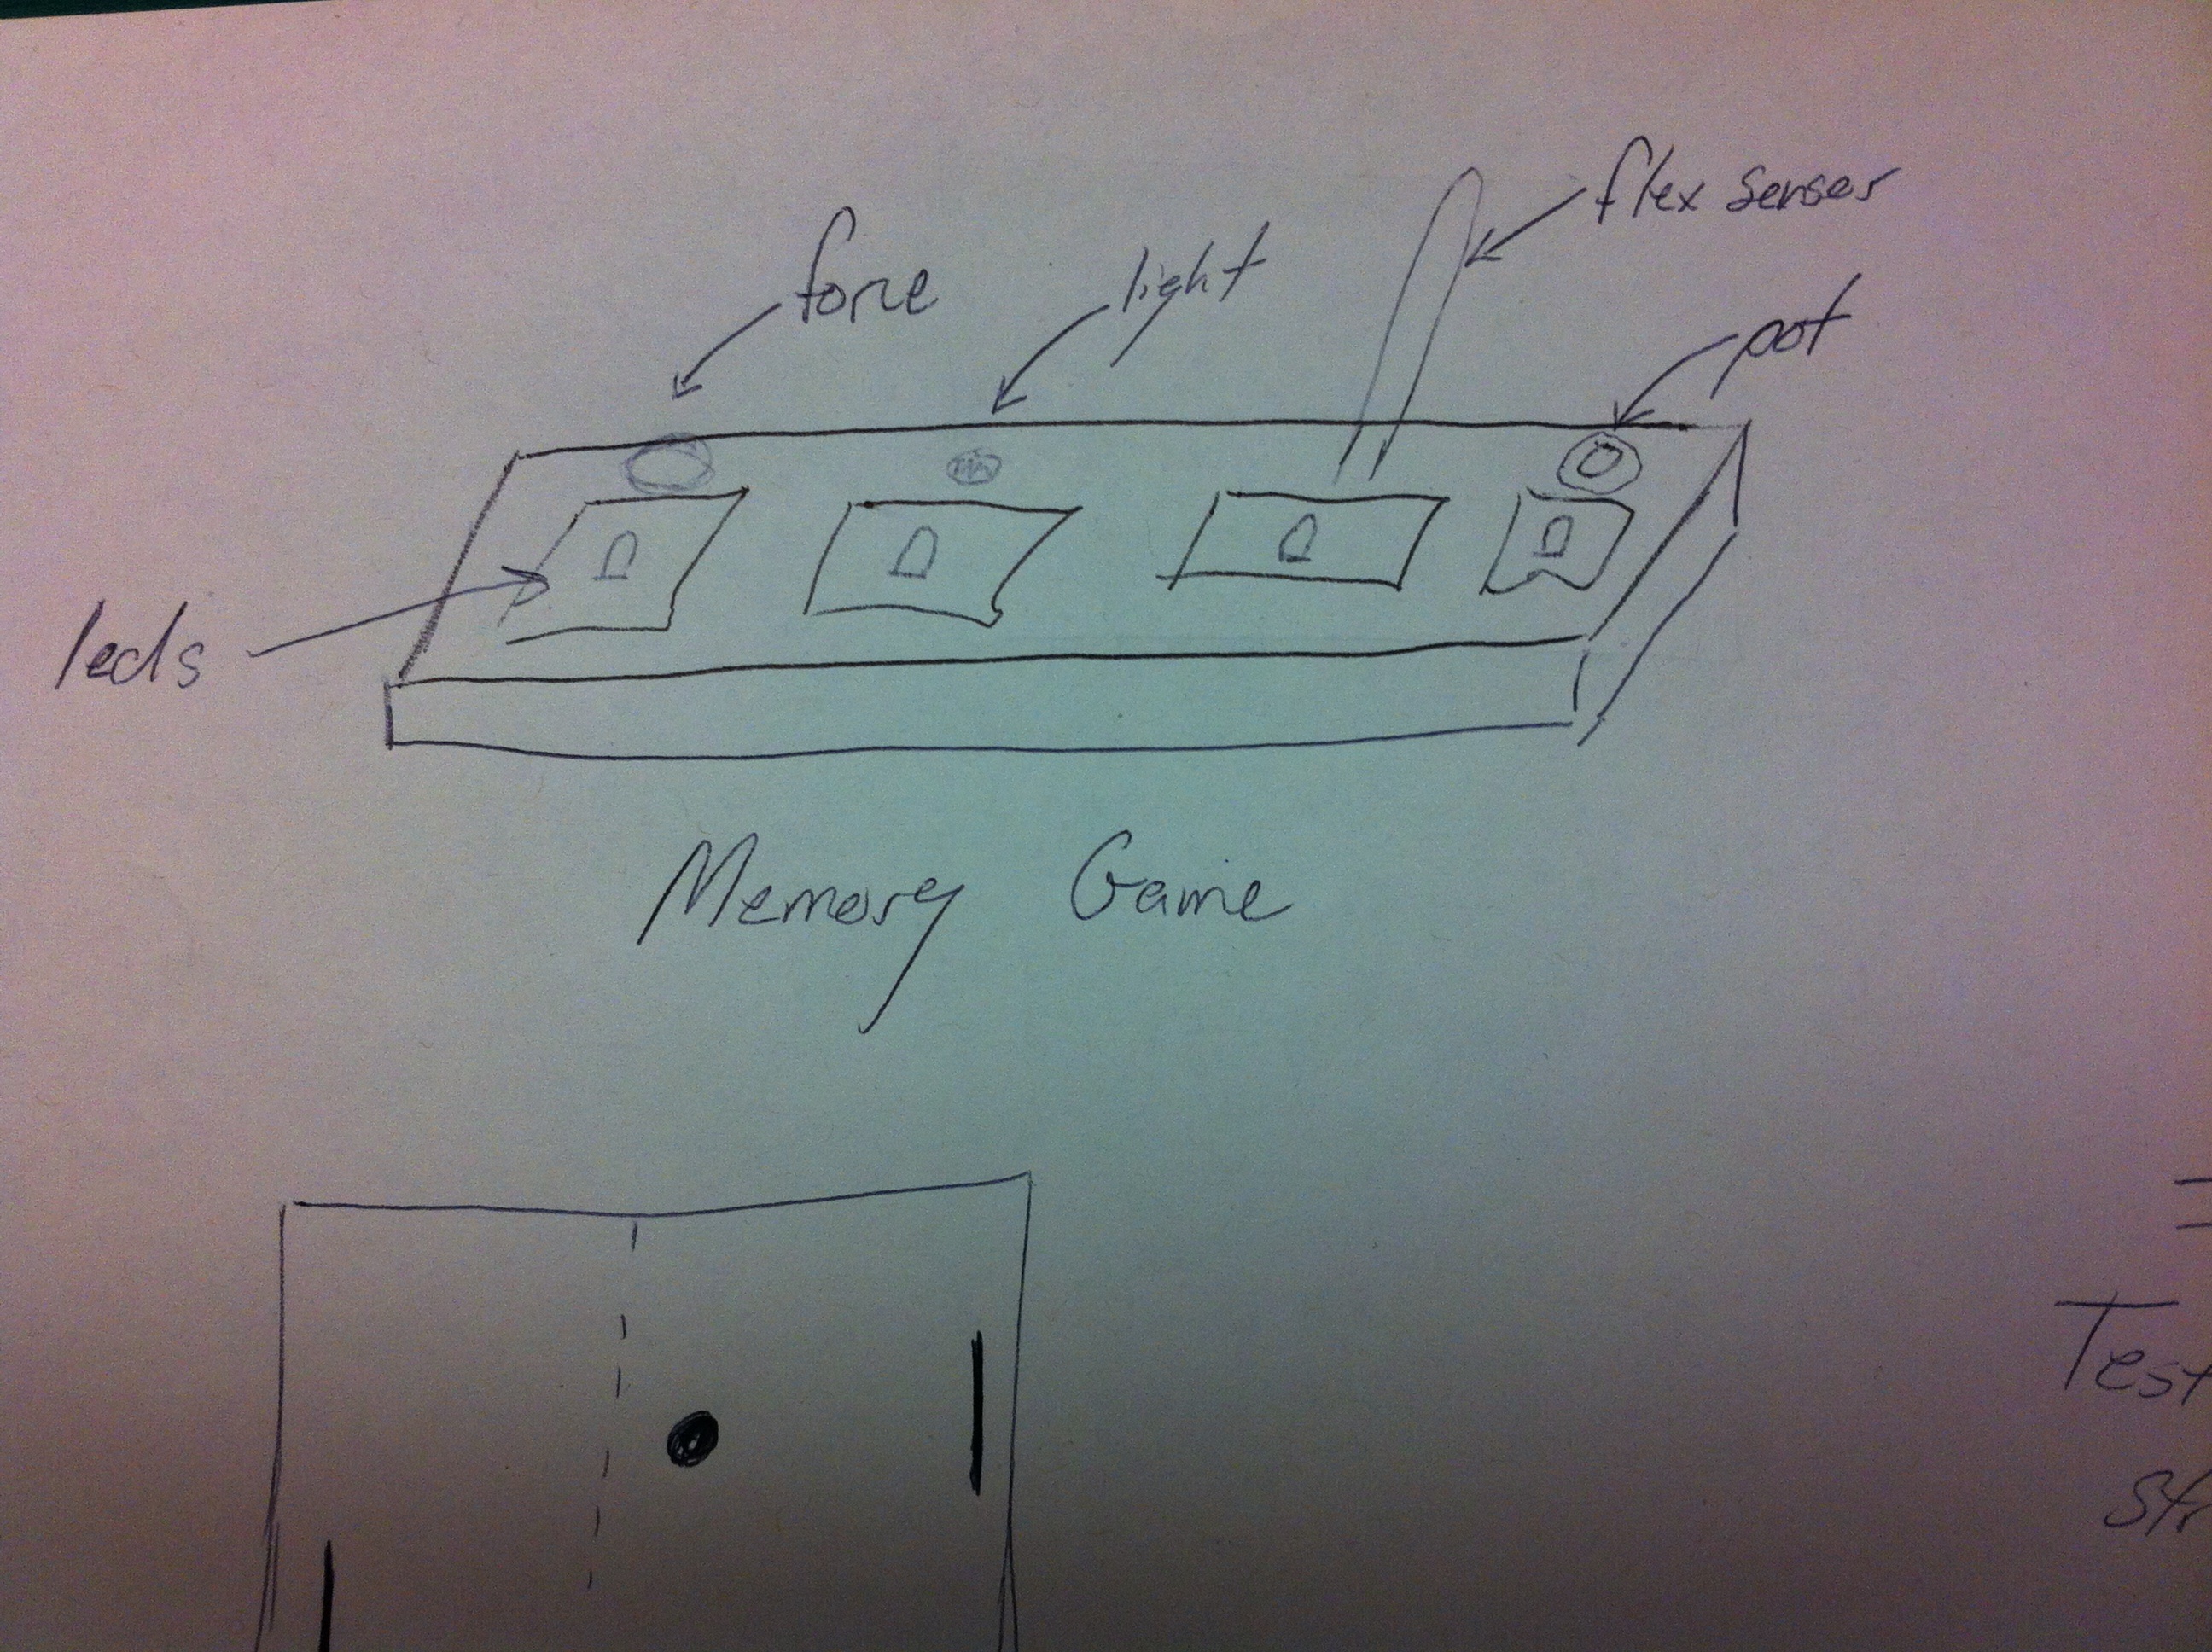
This is a picture of a memory game with different sensors. The Arduino would tell the user what order to interact with the sensors by turning on and off LED lights associated with each sensor.
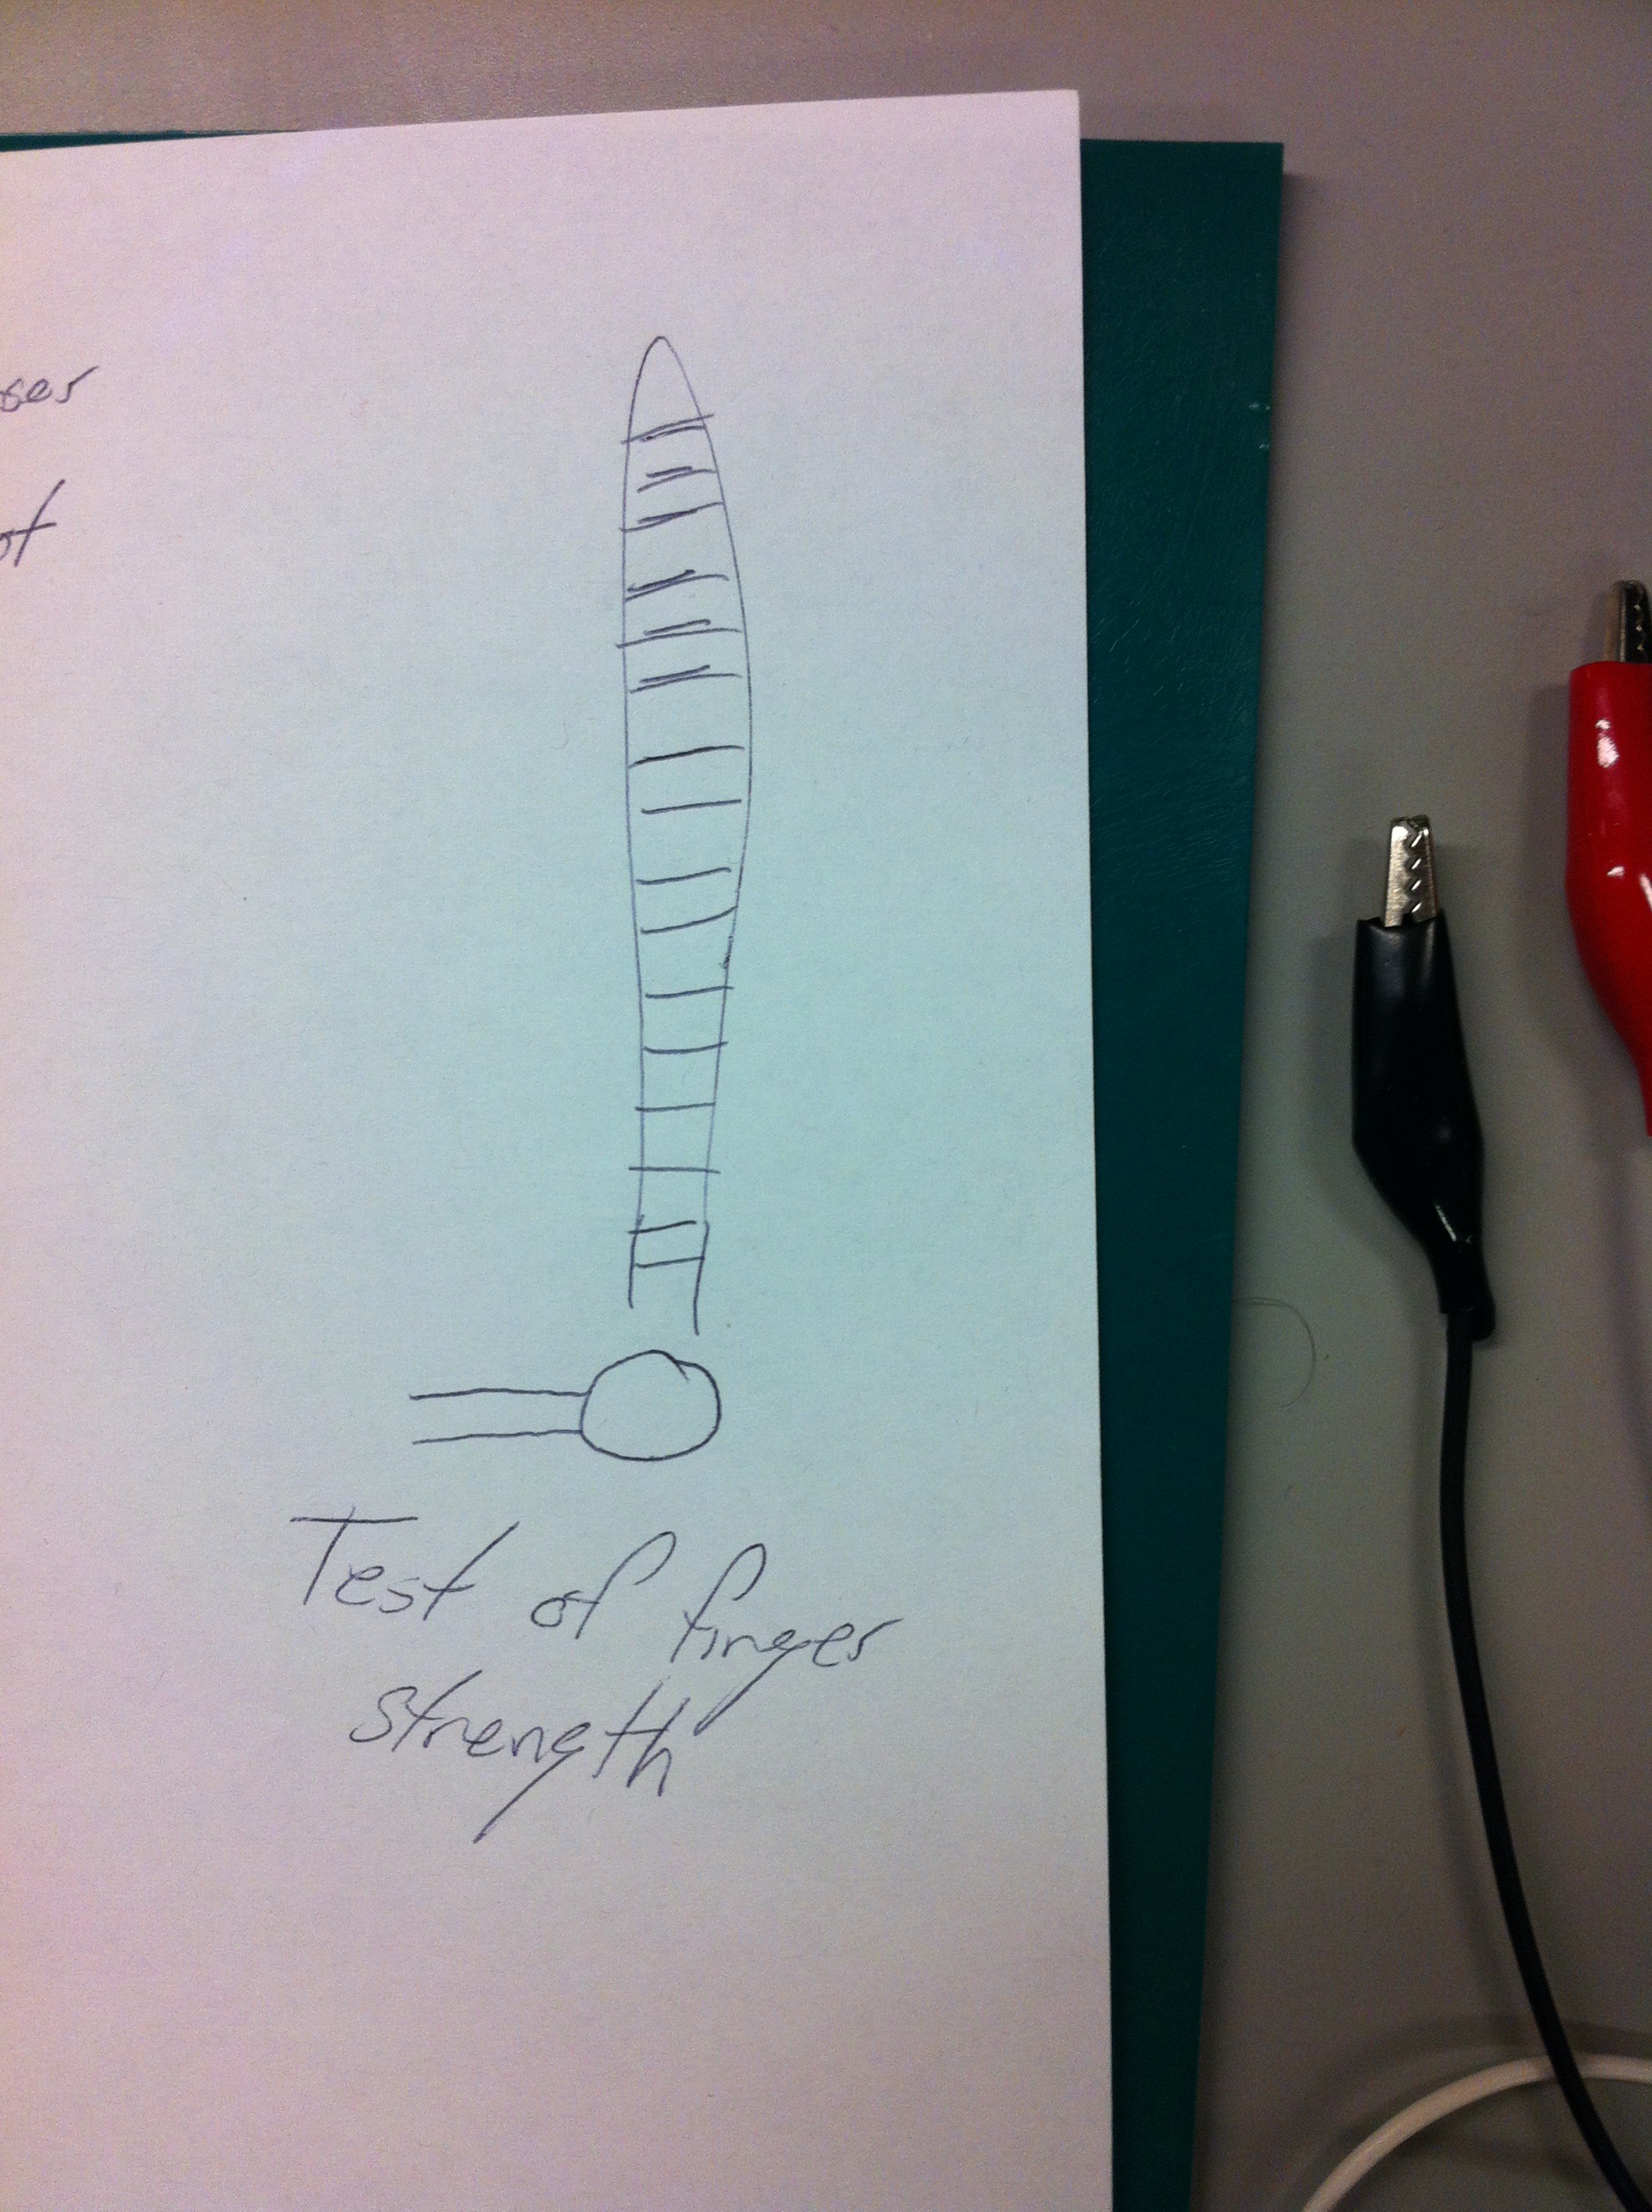
This is a flex sensor connected to an Arduino that allows users to measure finger strength. Alternatively, one could create a game by trying to match the sensor output with a randomly generated number.
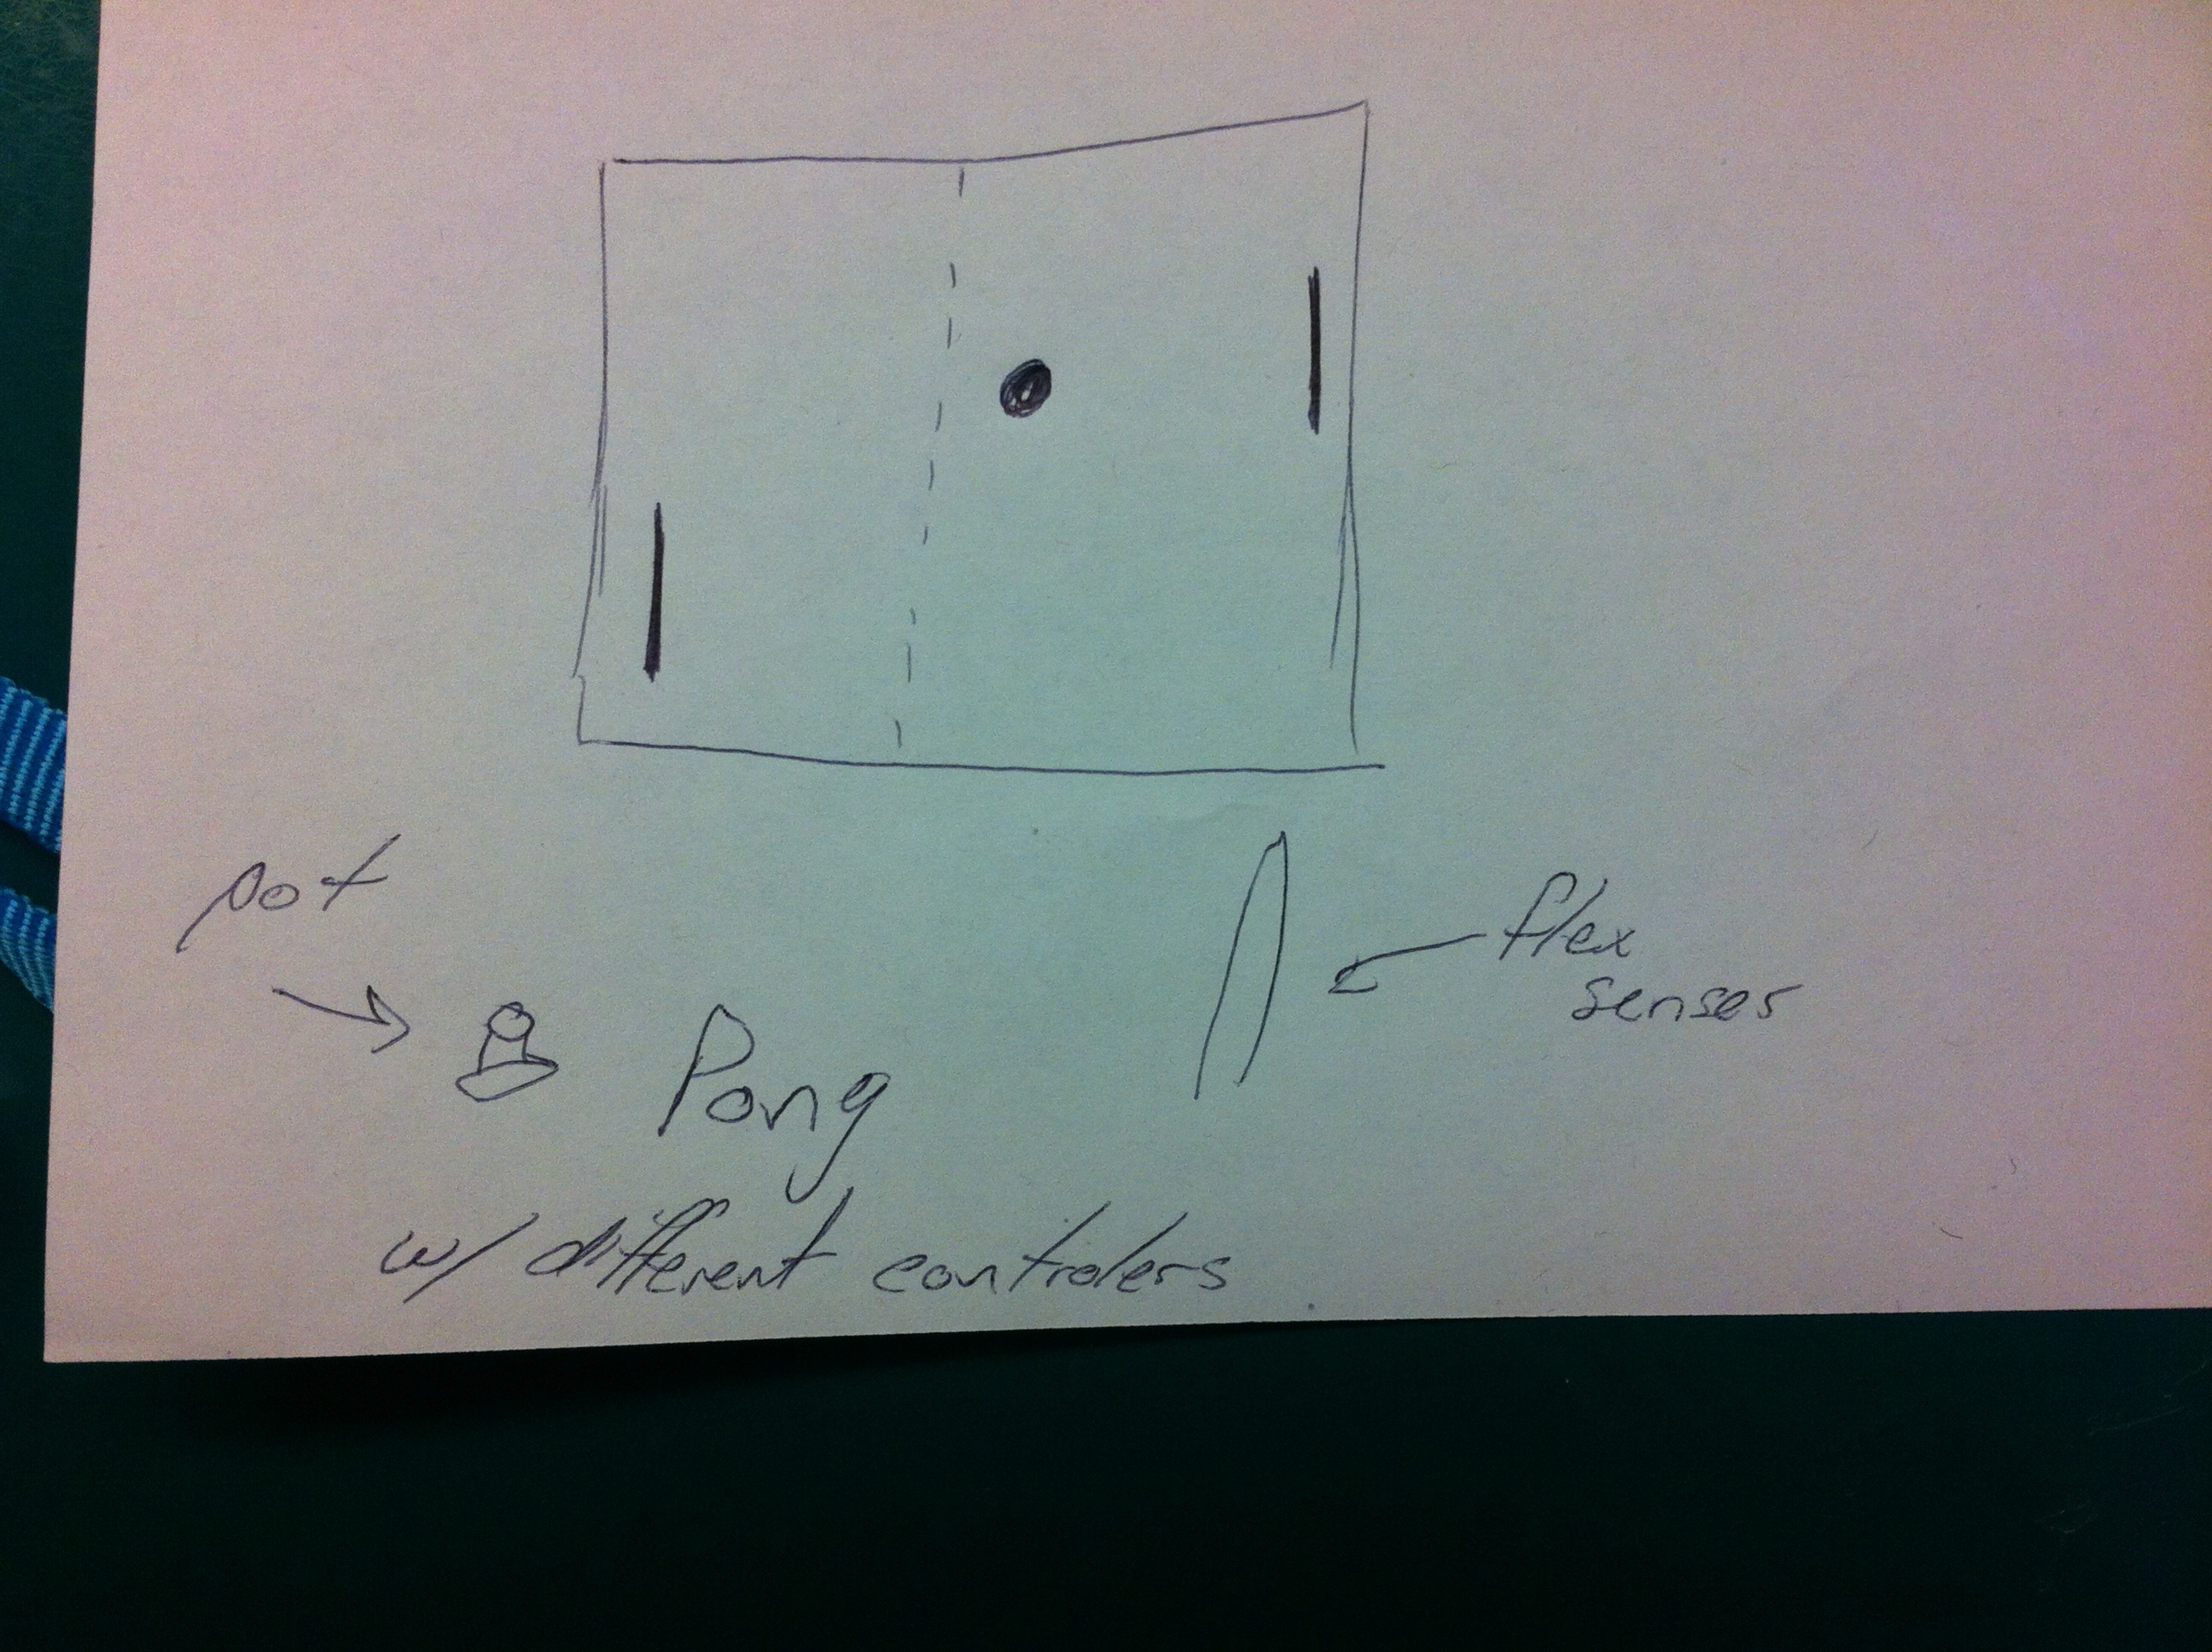
Our third idea is create a game of pong with different sensors. Competitors will use the sensors to move the paddles up and down on the screen.
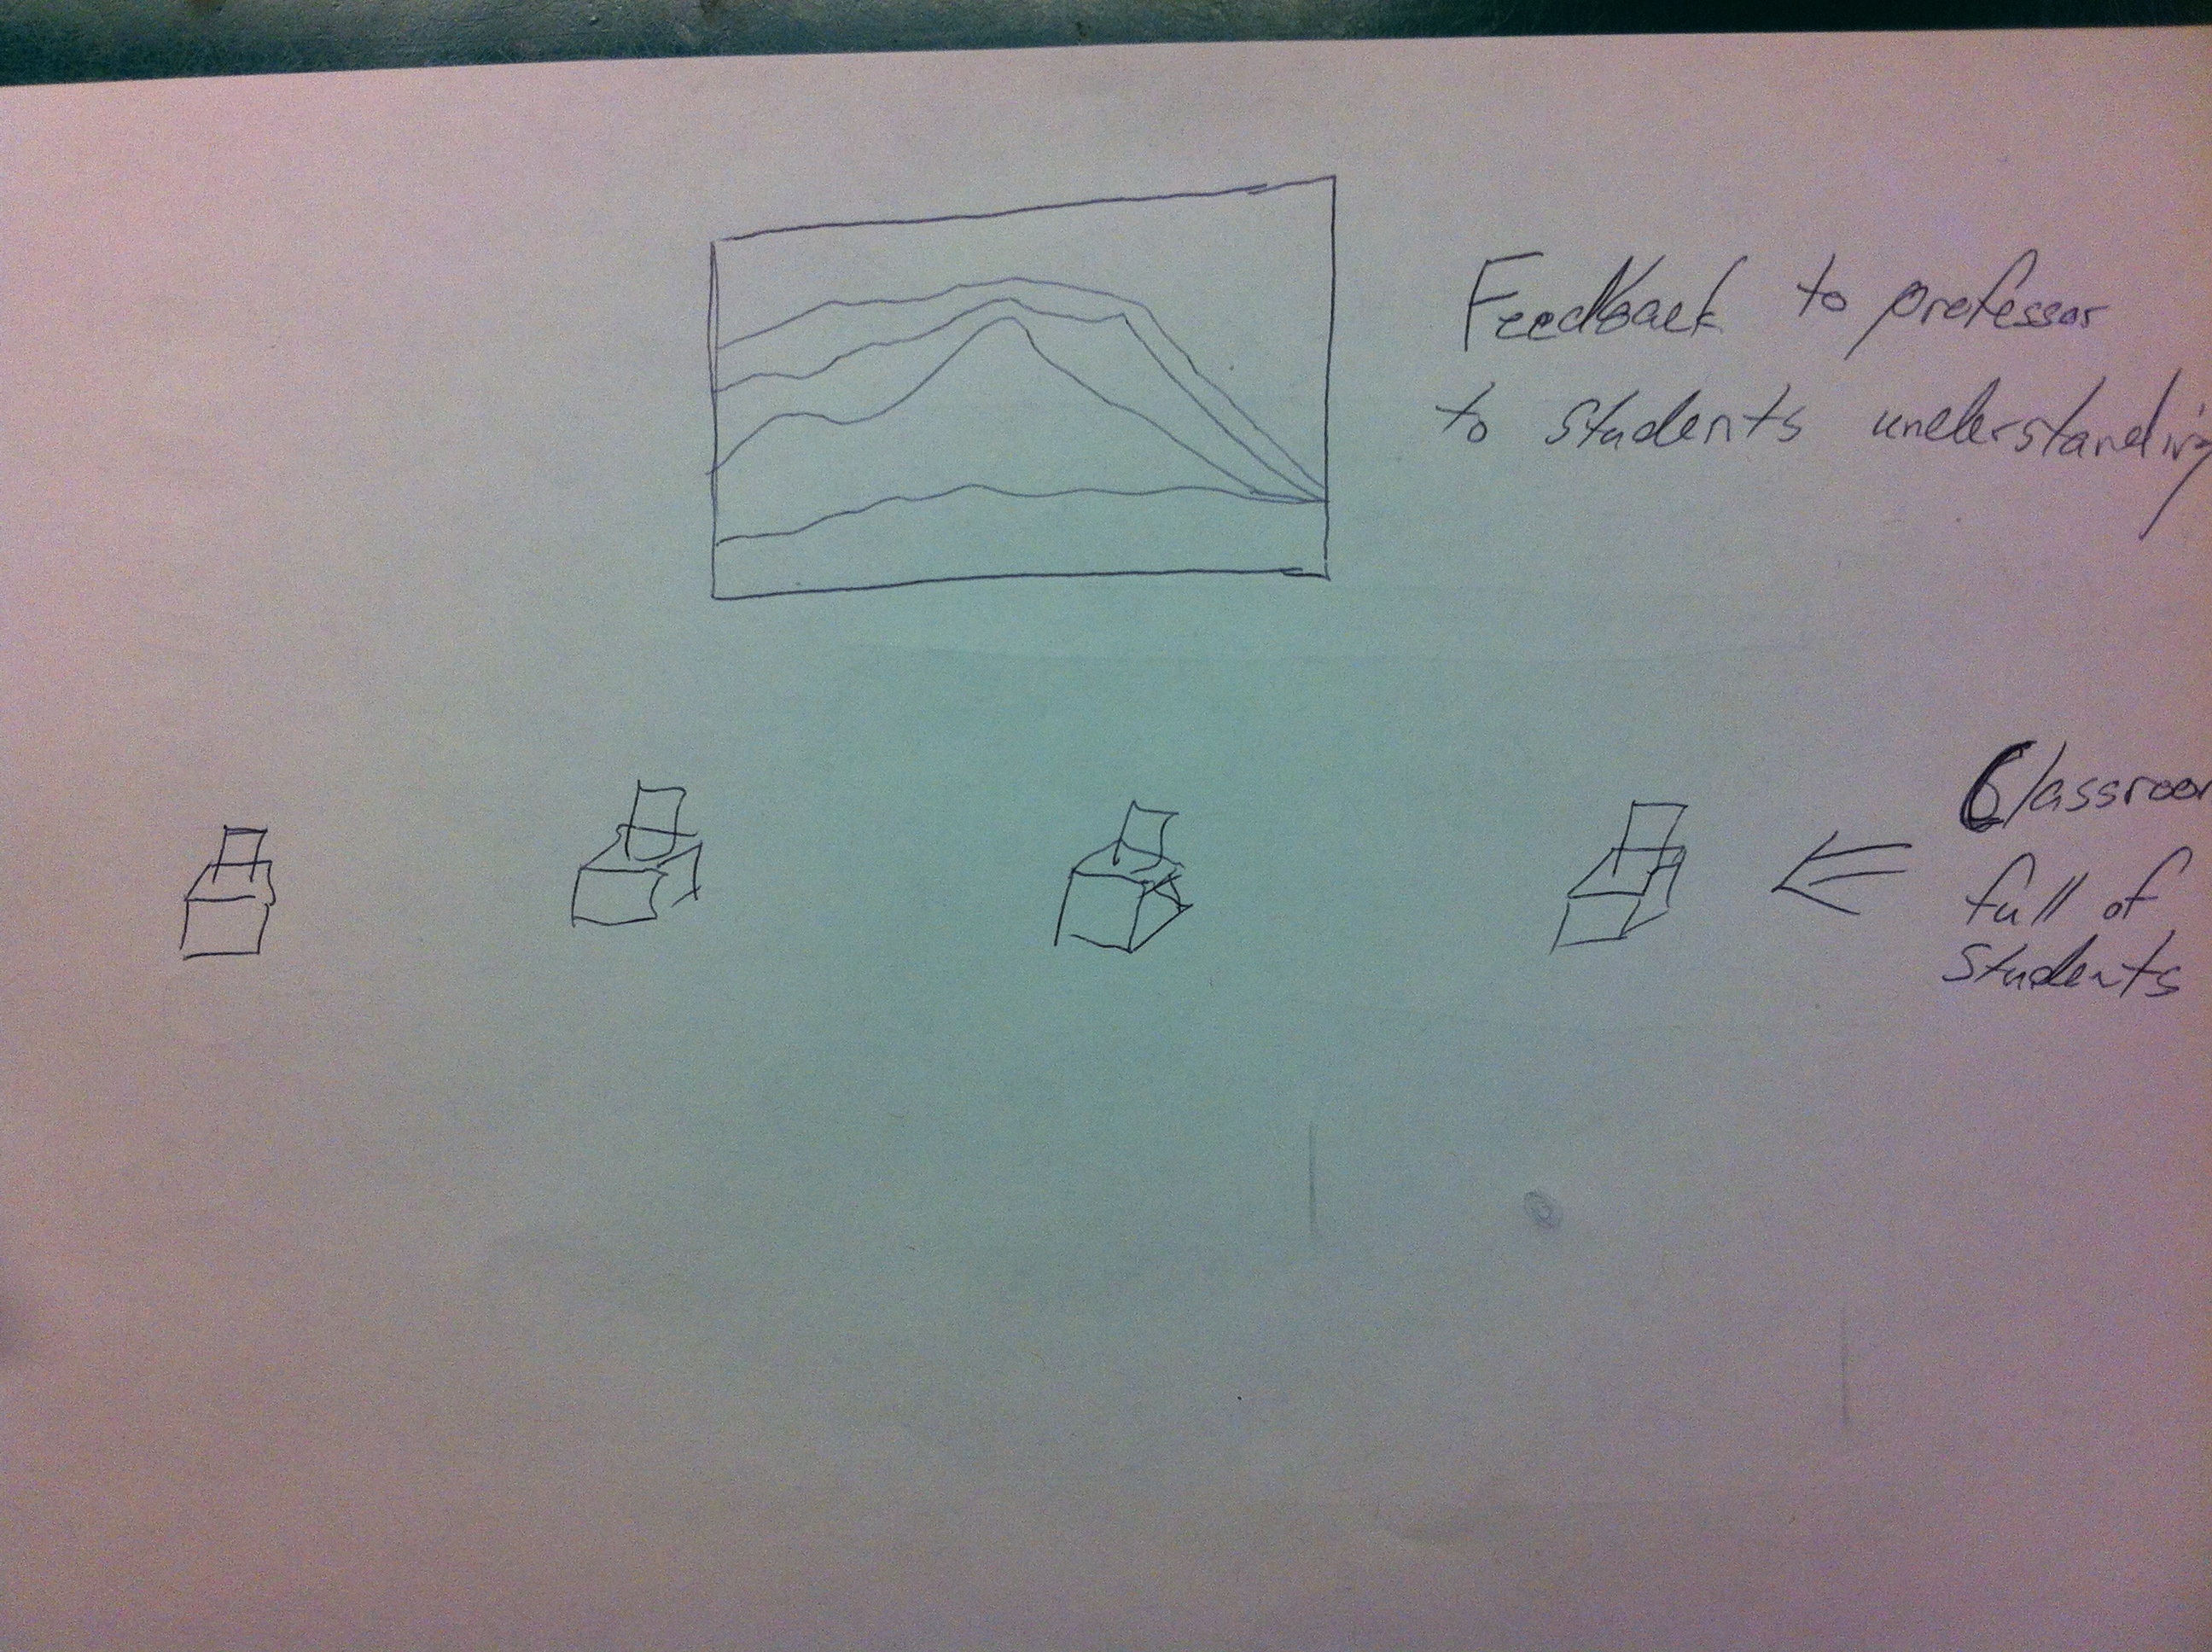
Our last idea is to create some mechanism for students to provide real time feedback for teachers.
What We Built and Why:
We built an education utility that allows the students of a class to provide feedback, through potentiometers mounted in their desks, to a teacher or professor. This feedback is then amalgamated into a single graphic that allows the professor to get a reading of the class at a glance. Our project was definitely successful. We were able to produce a reasonably good graphical display from three simulated “students.” We also added lifetime min and max lines that help the teacher gauge the current confusion level of the class in comparison to the extremes. Going forward, we think there is huge potential for the idea. Possible extensions would be to allow students to provide different types of feedback, such as engagement and confusion. The real extension would be in how we could improve the display of the information to the professor. We are currently using a moving graph over time but added extensions like time decay and even adaptive learning algorithms might help the professor get a better snapshot of the class at a glance.
Storyboard:
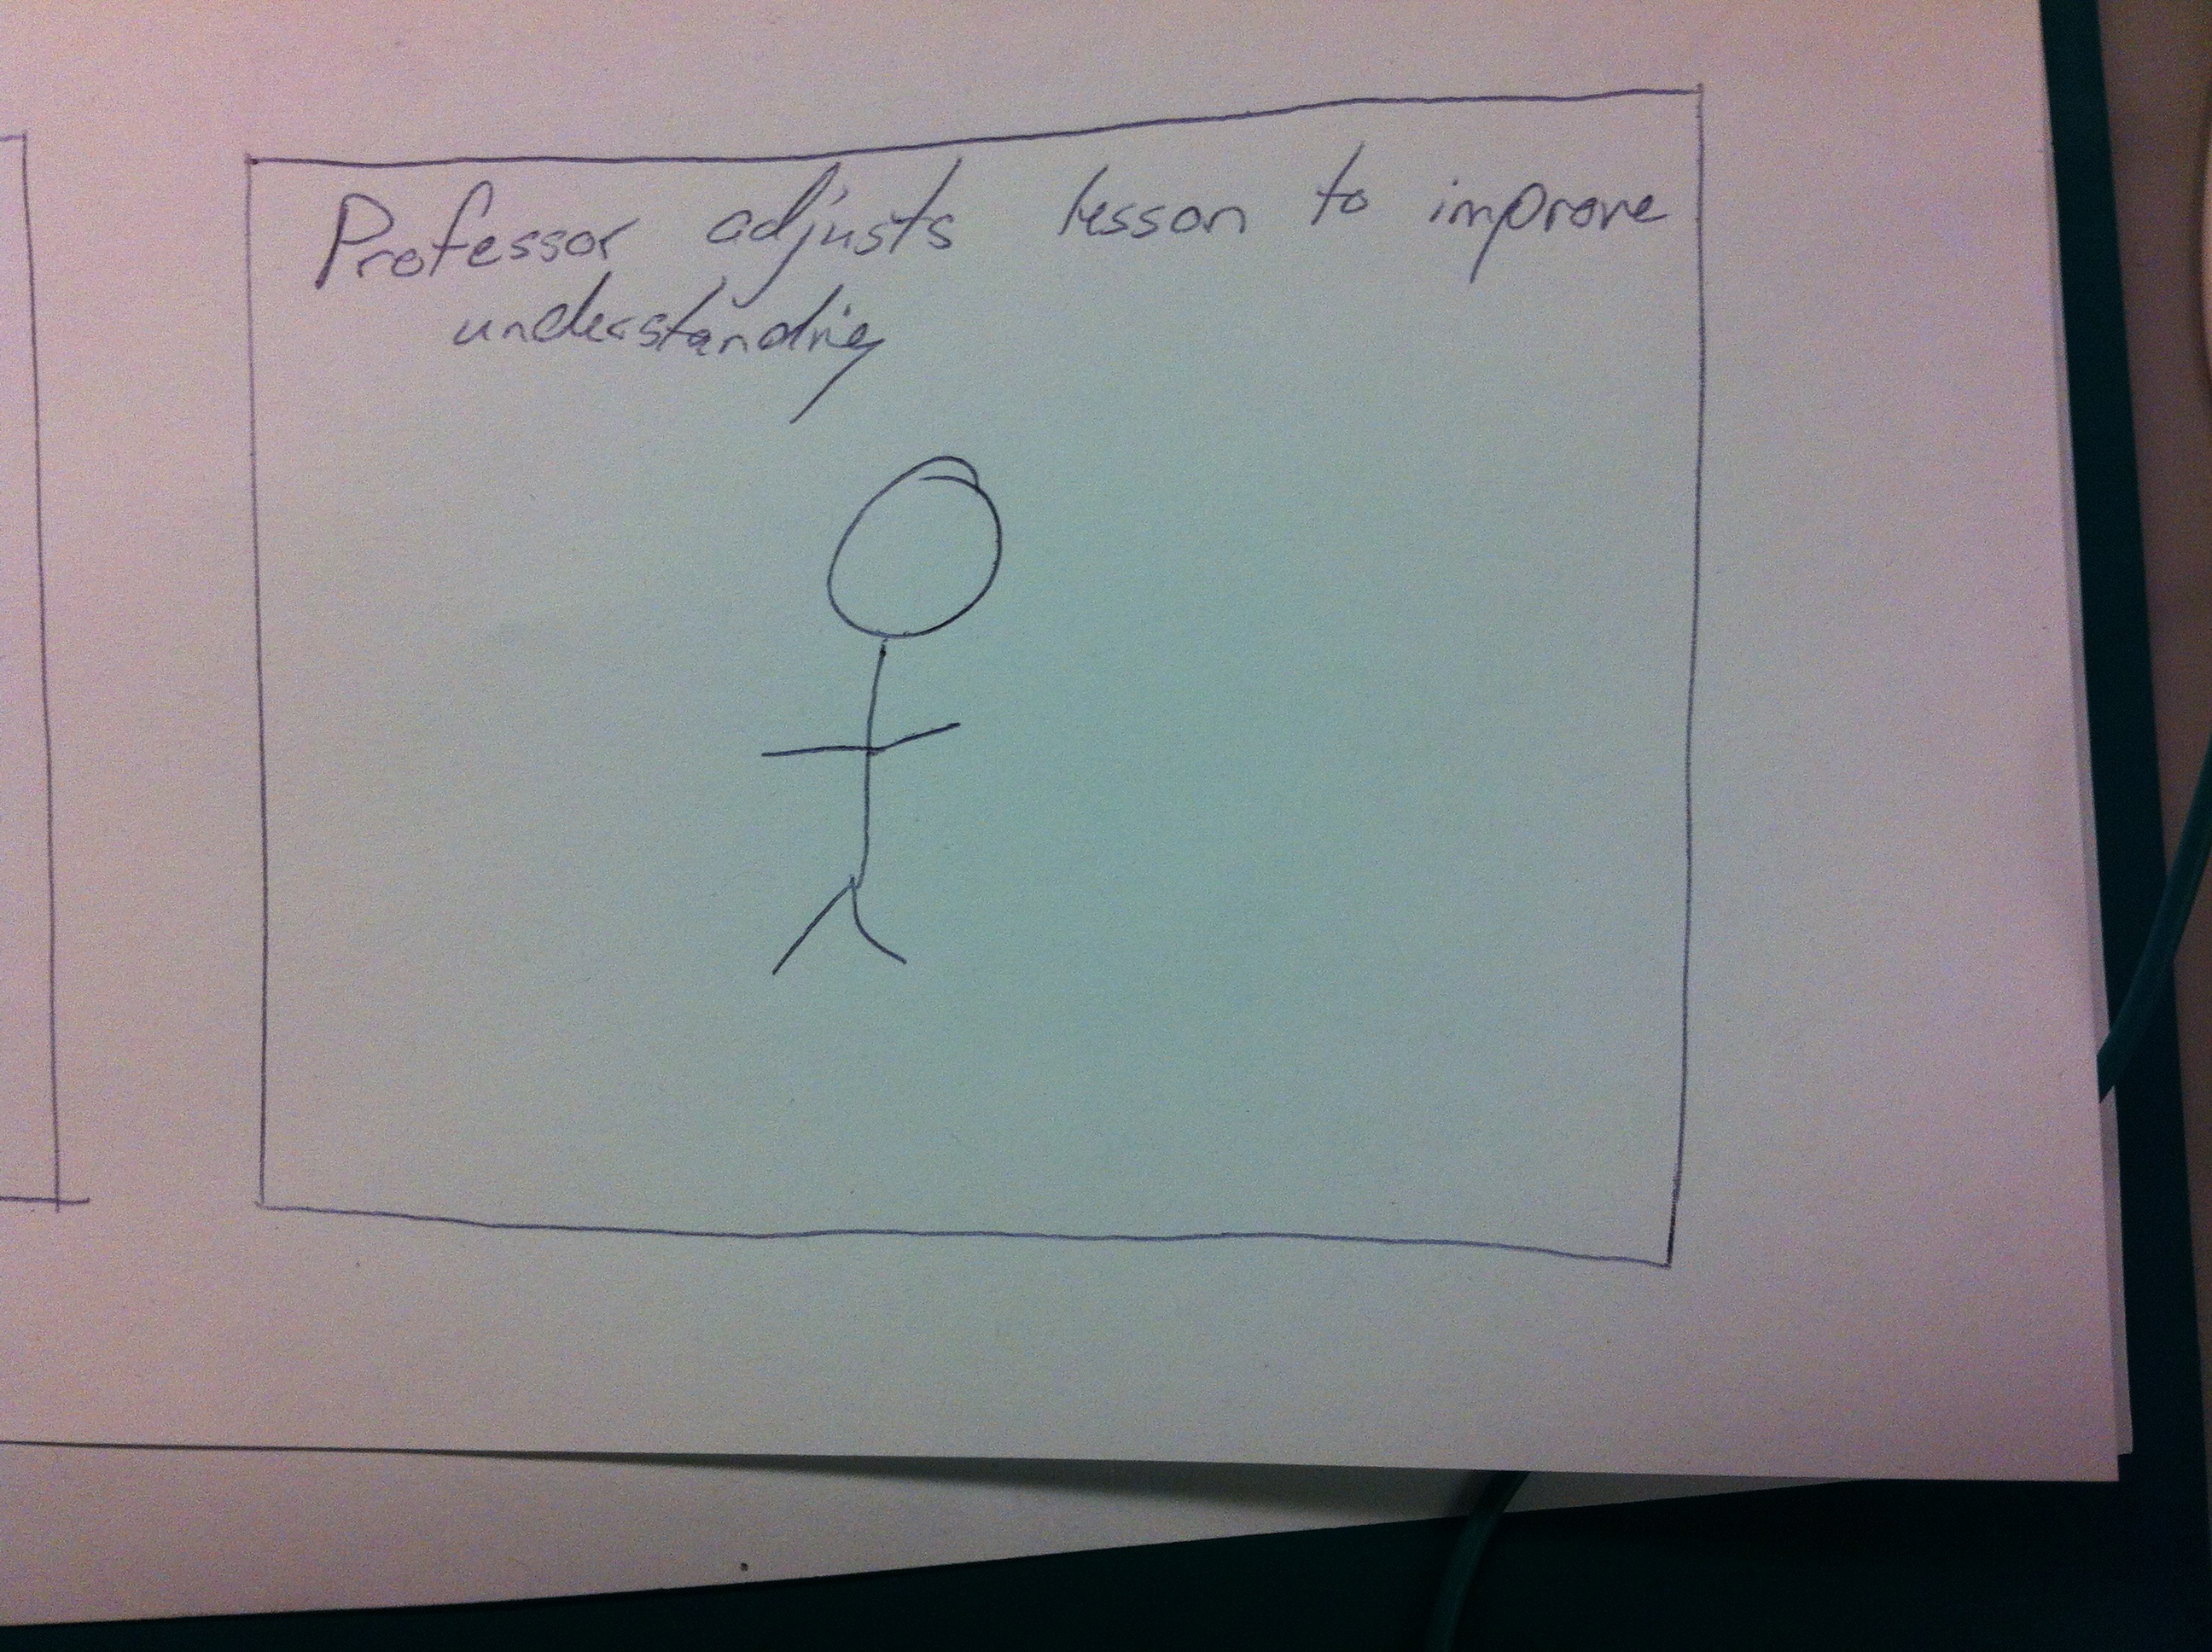
In use:
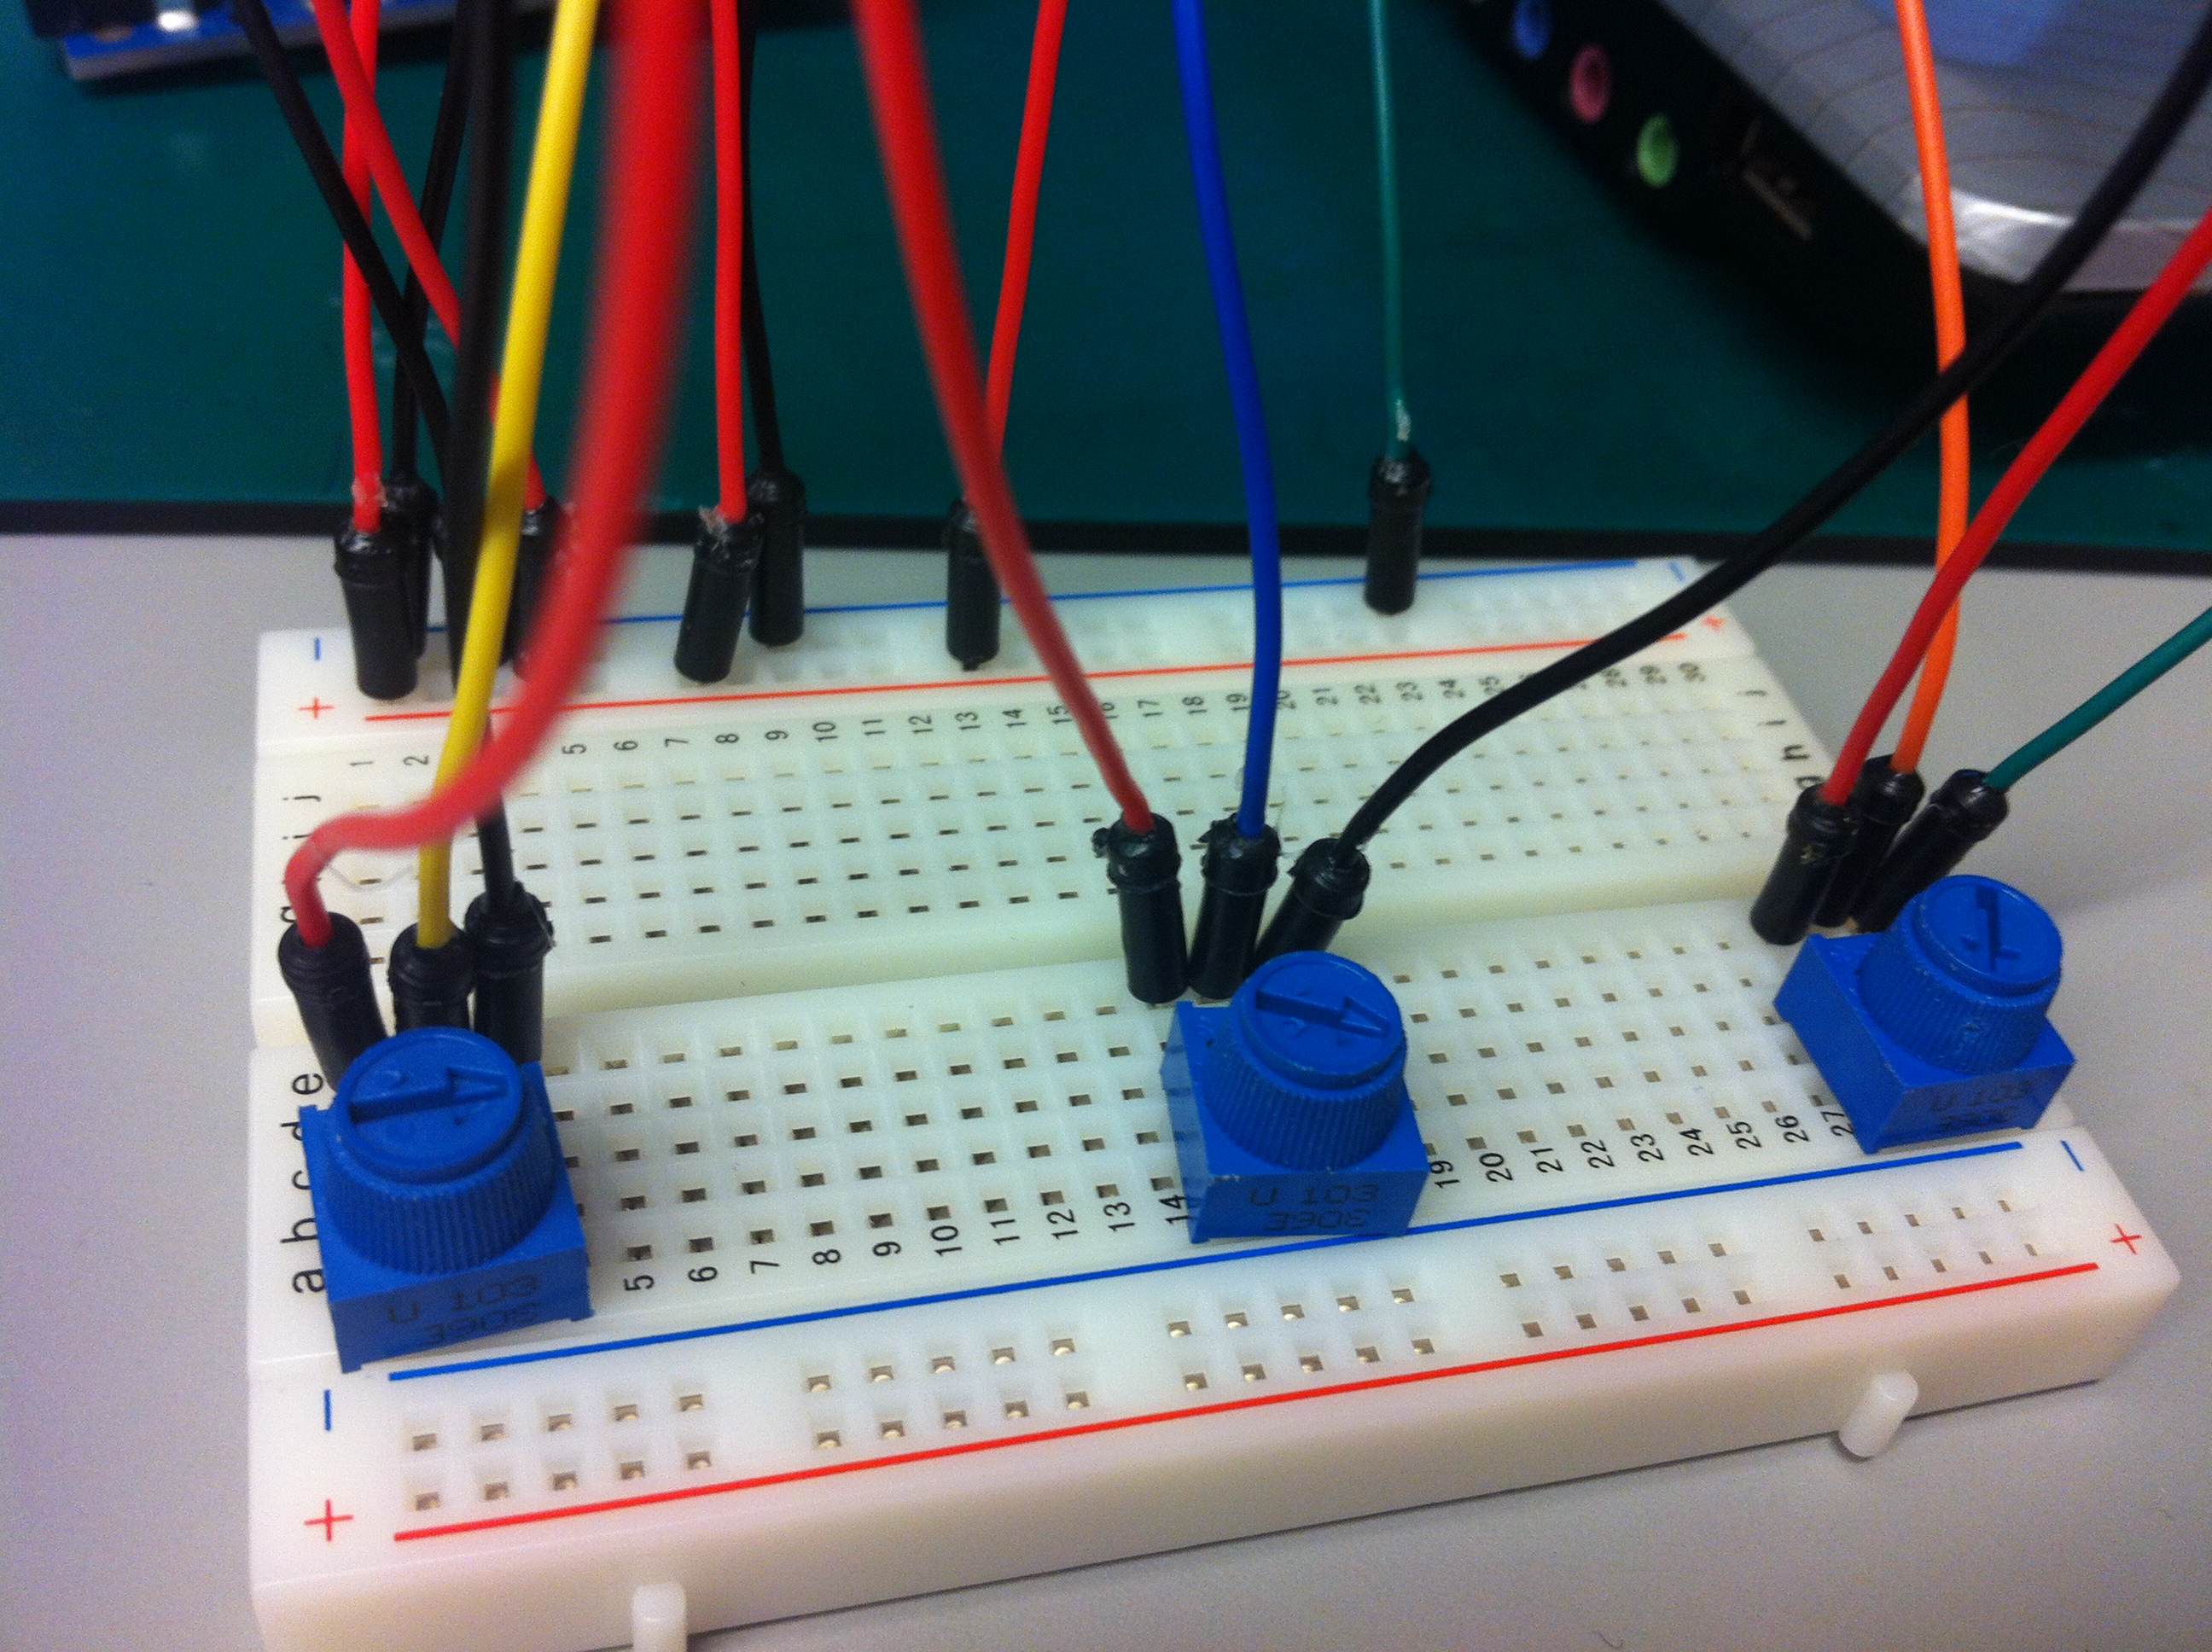
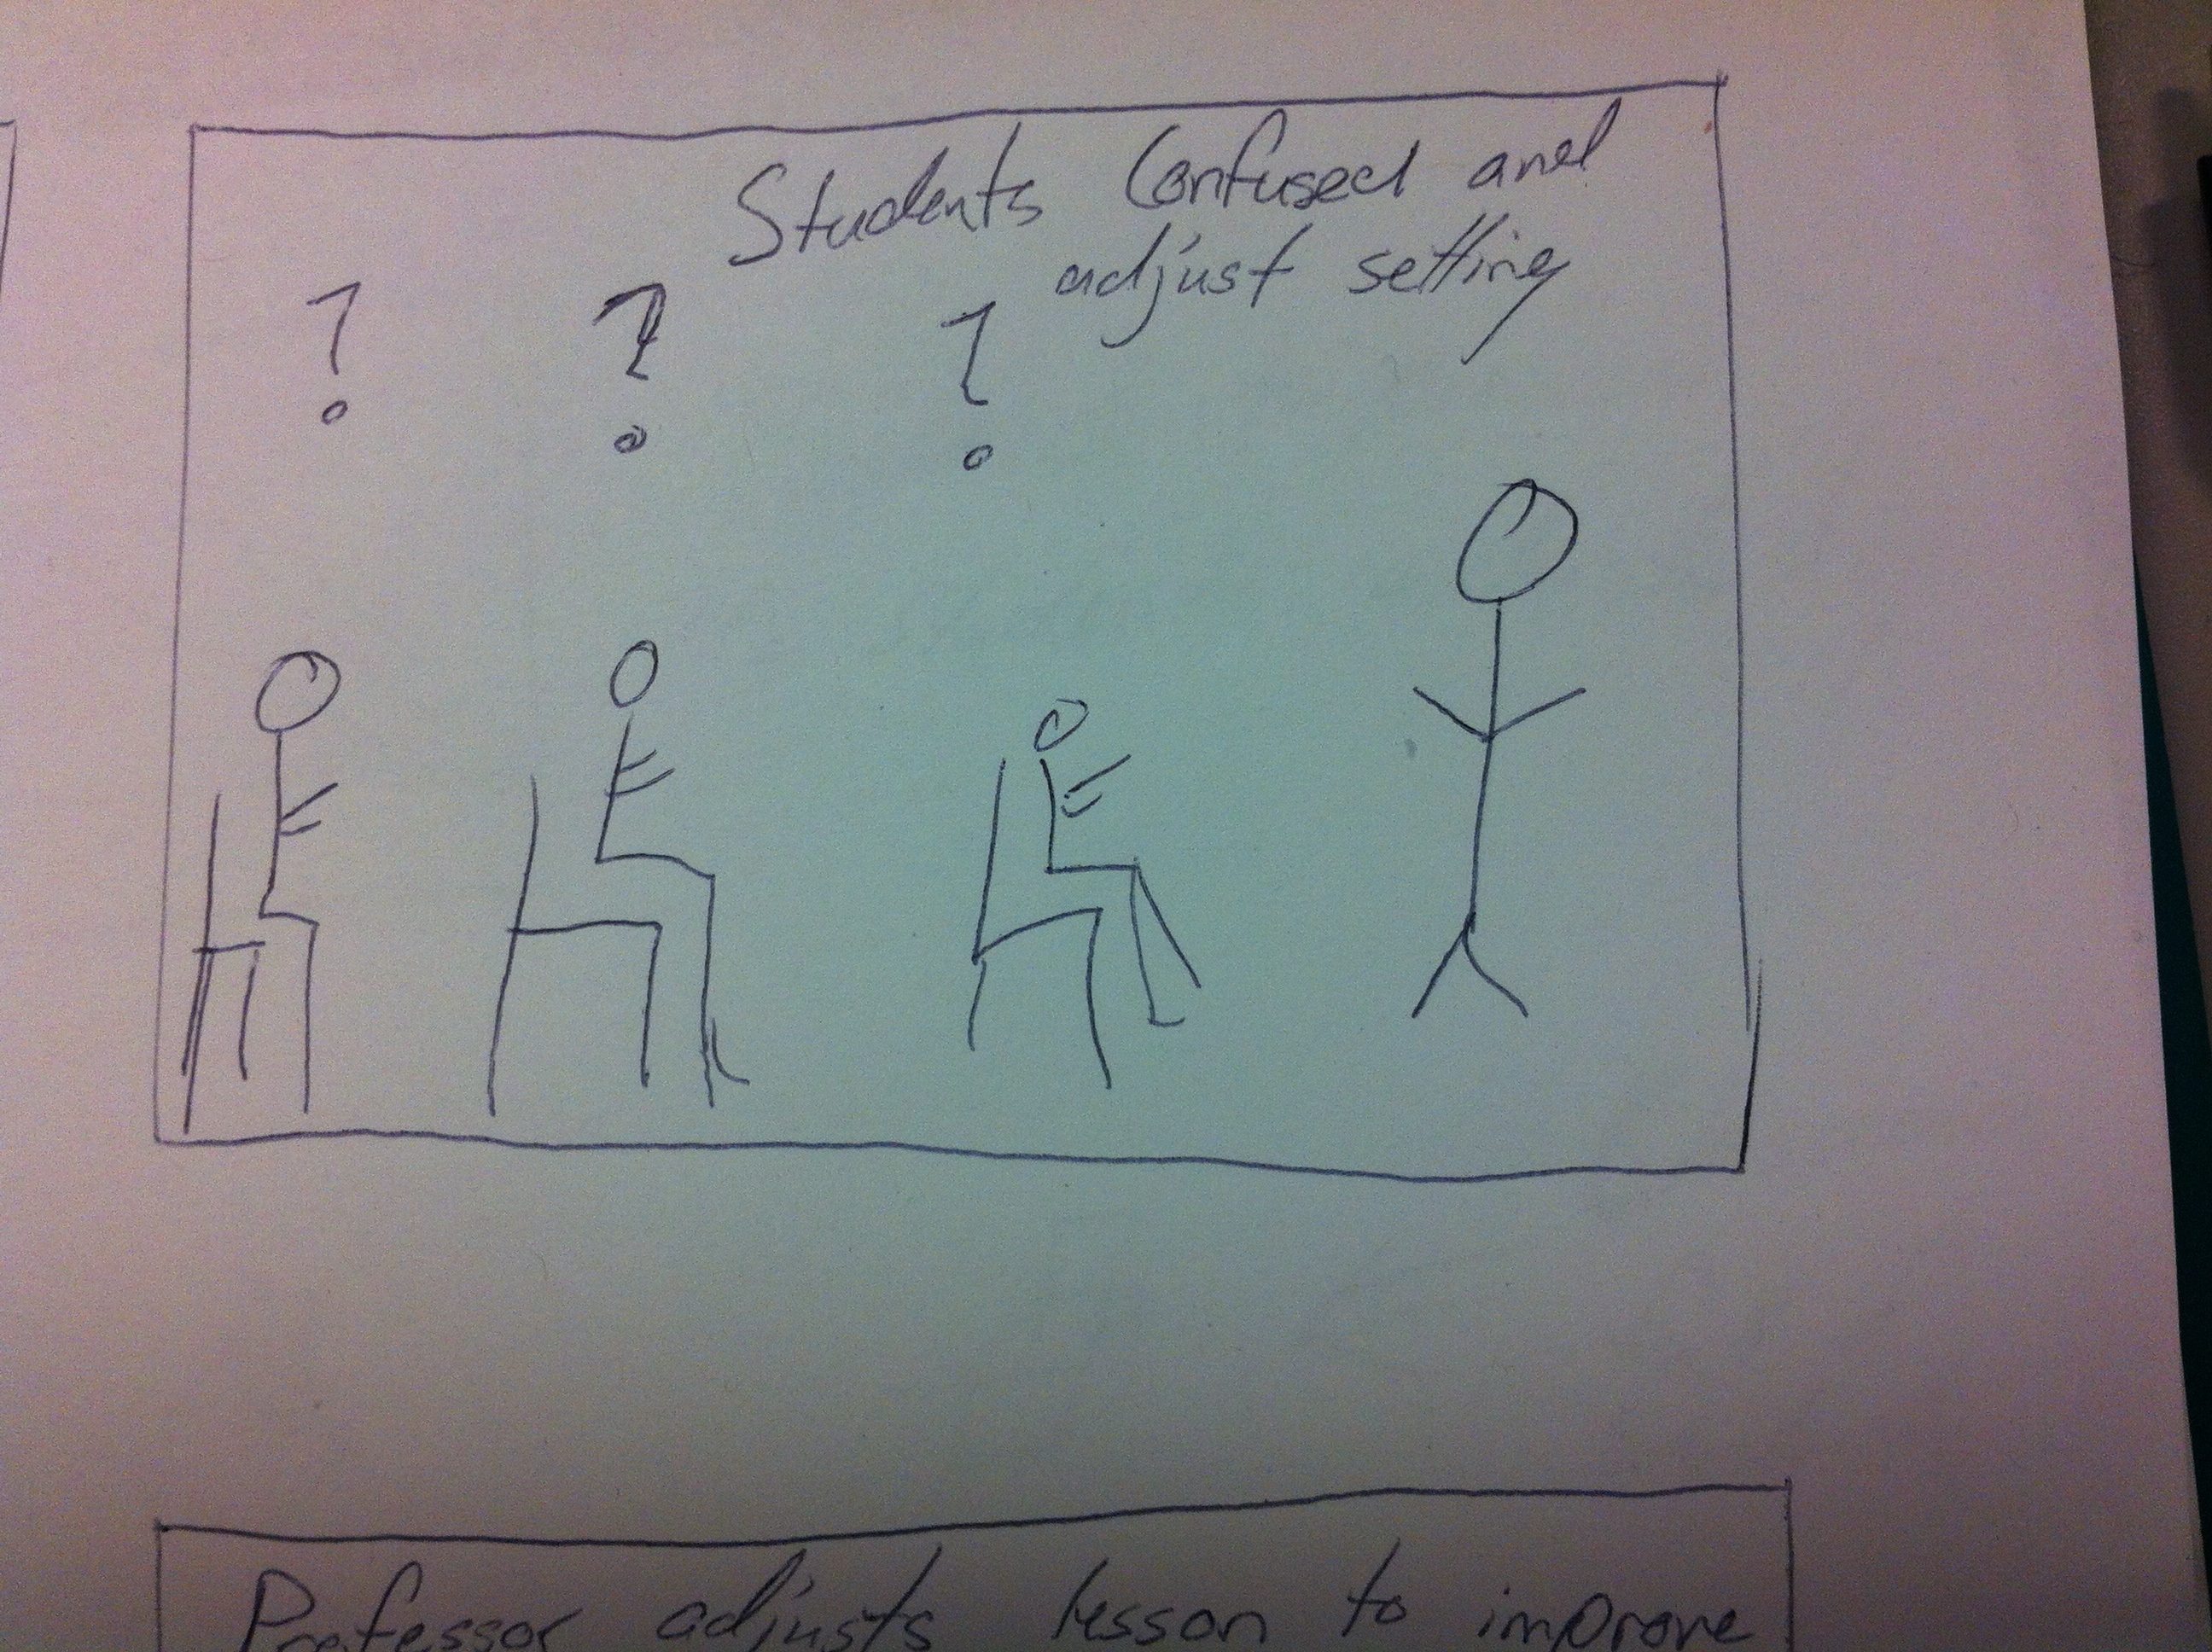
Feedback nobs that students control
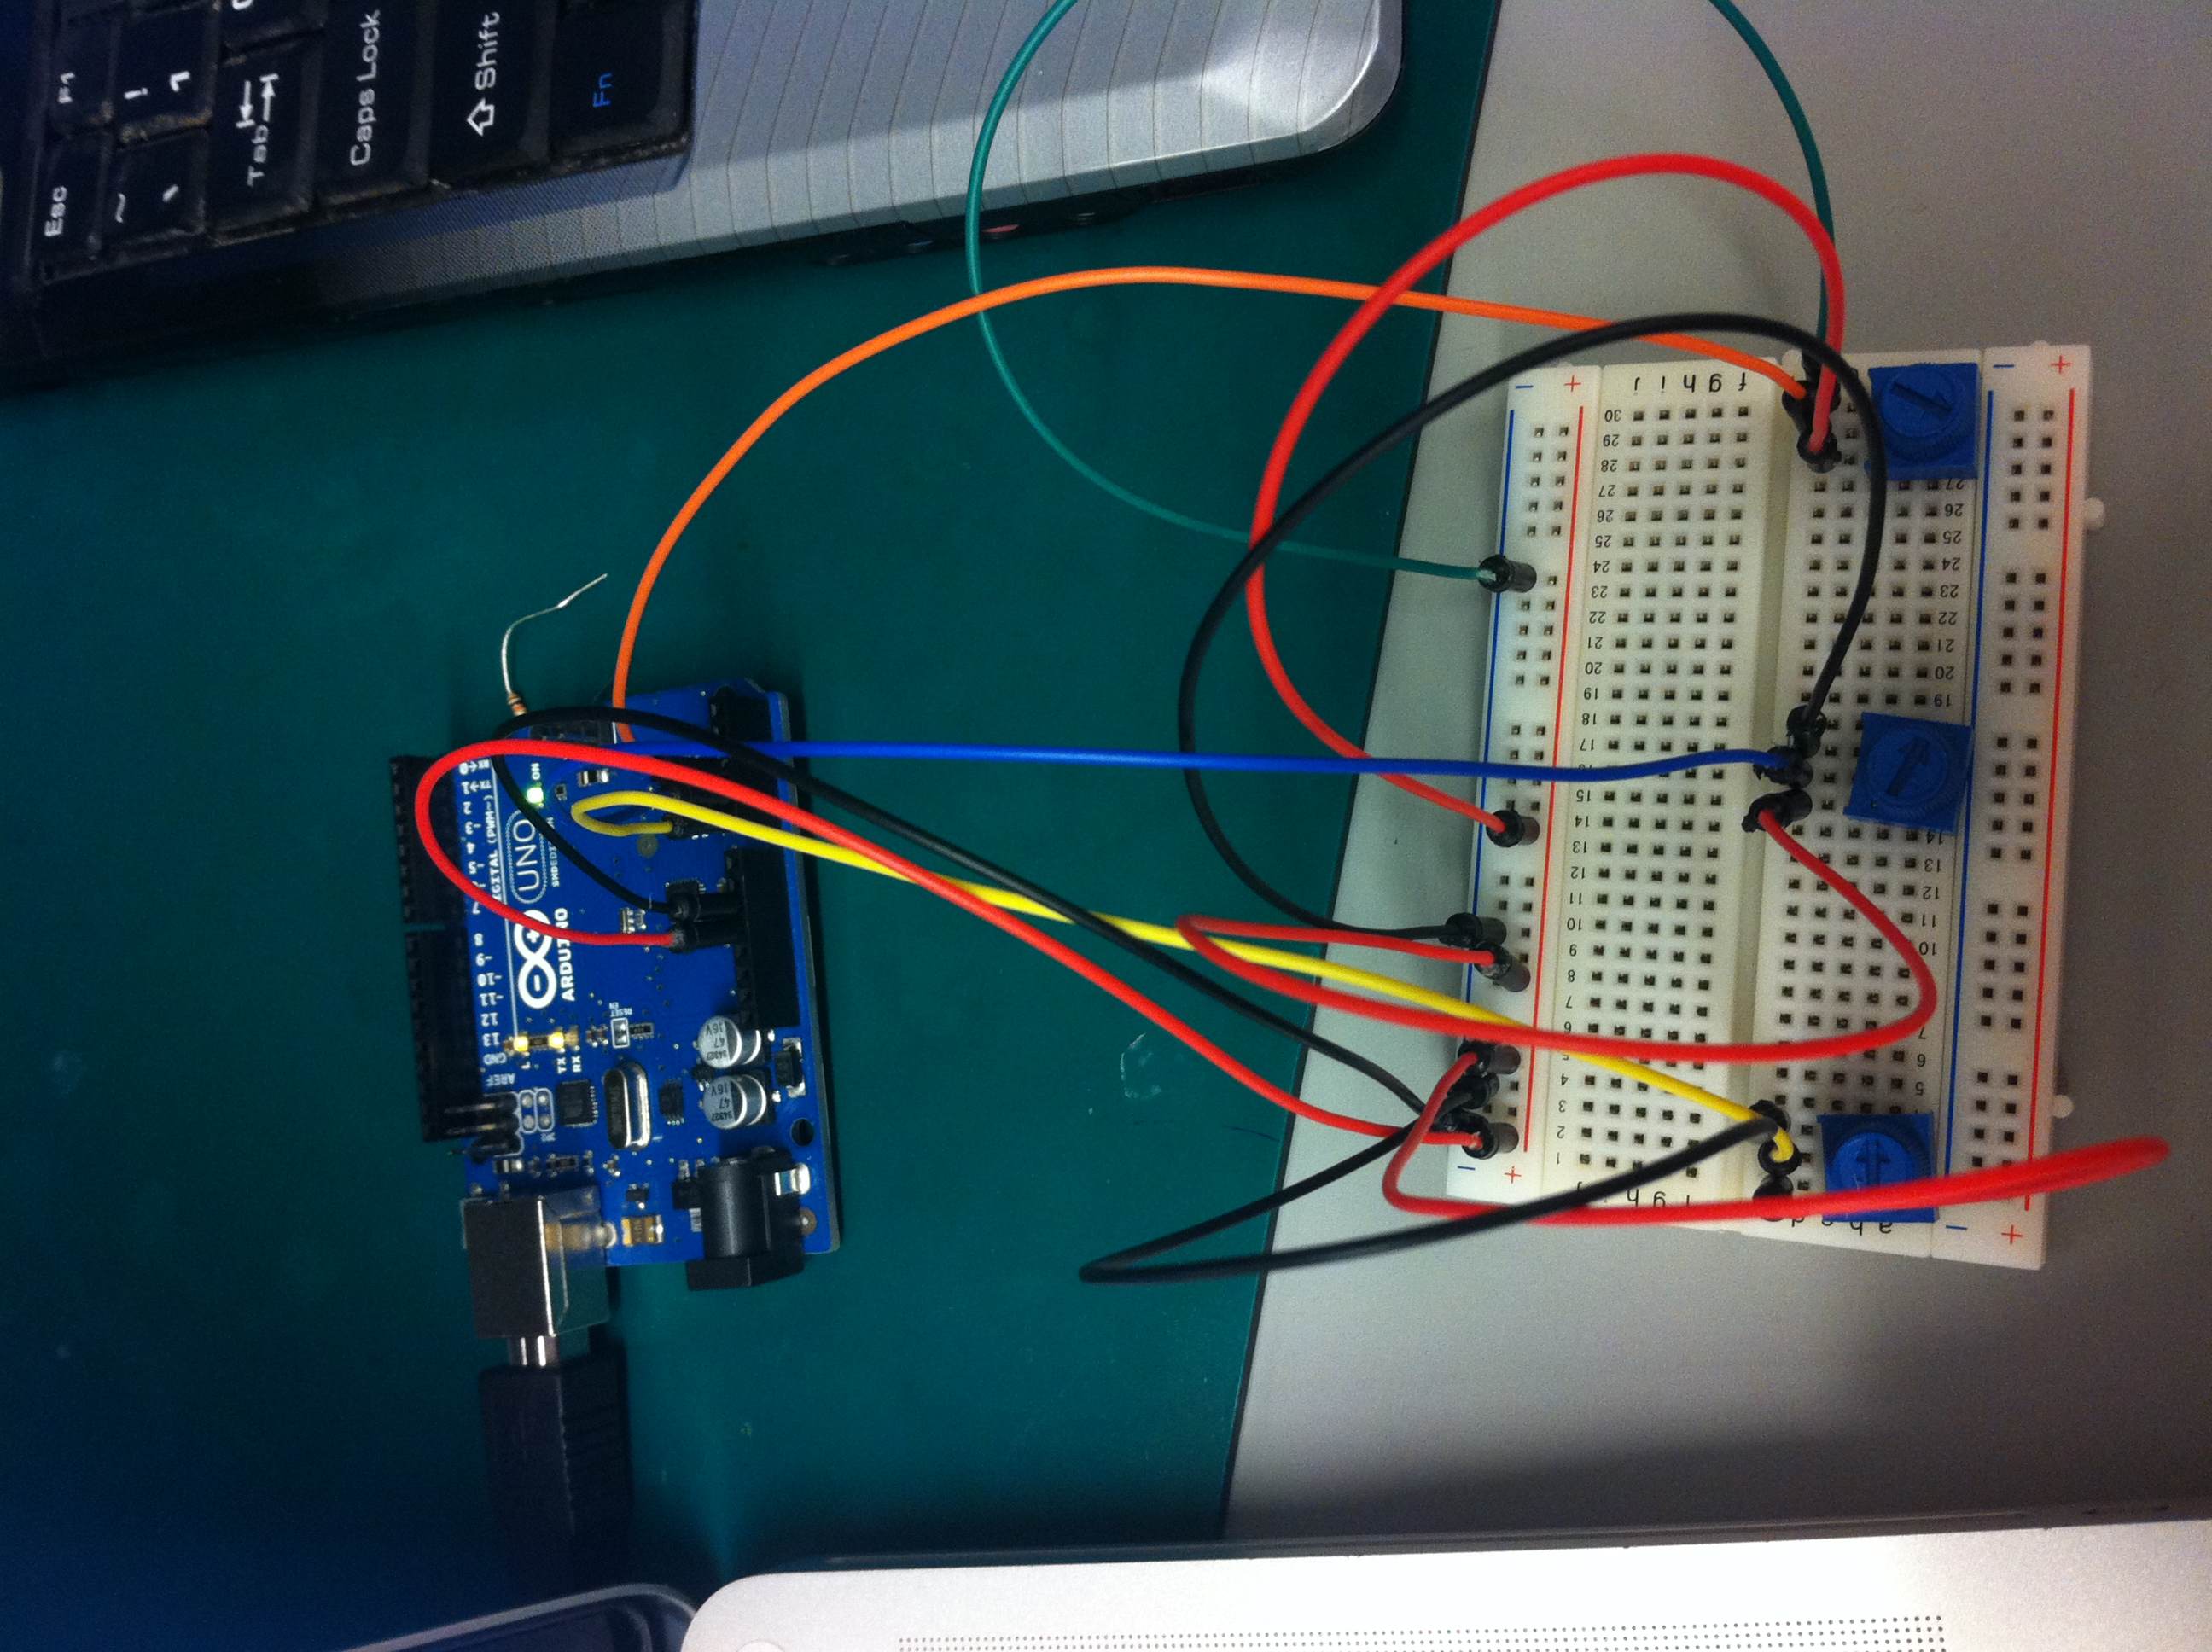
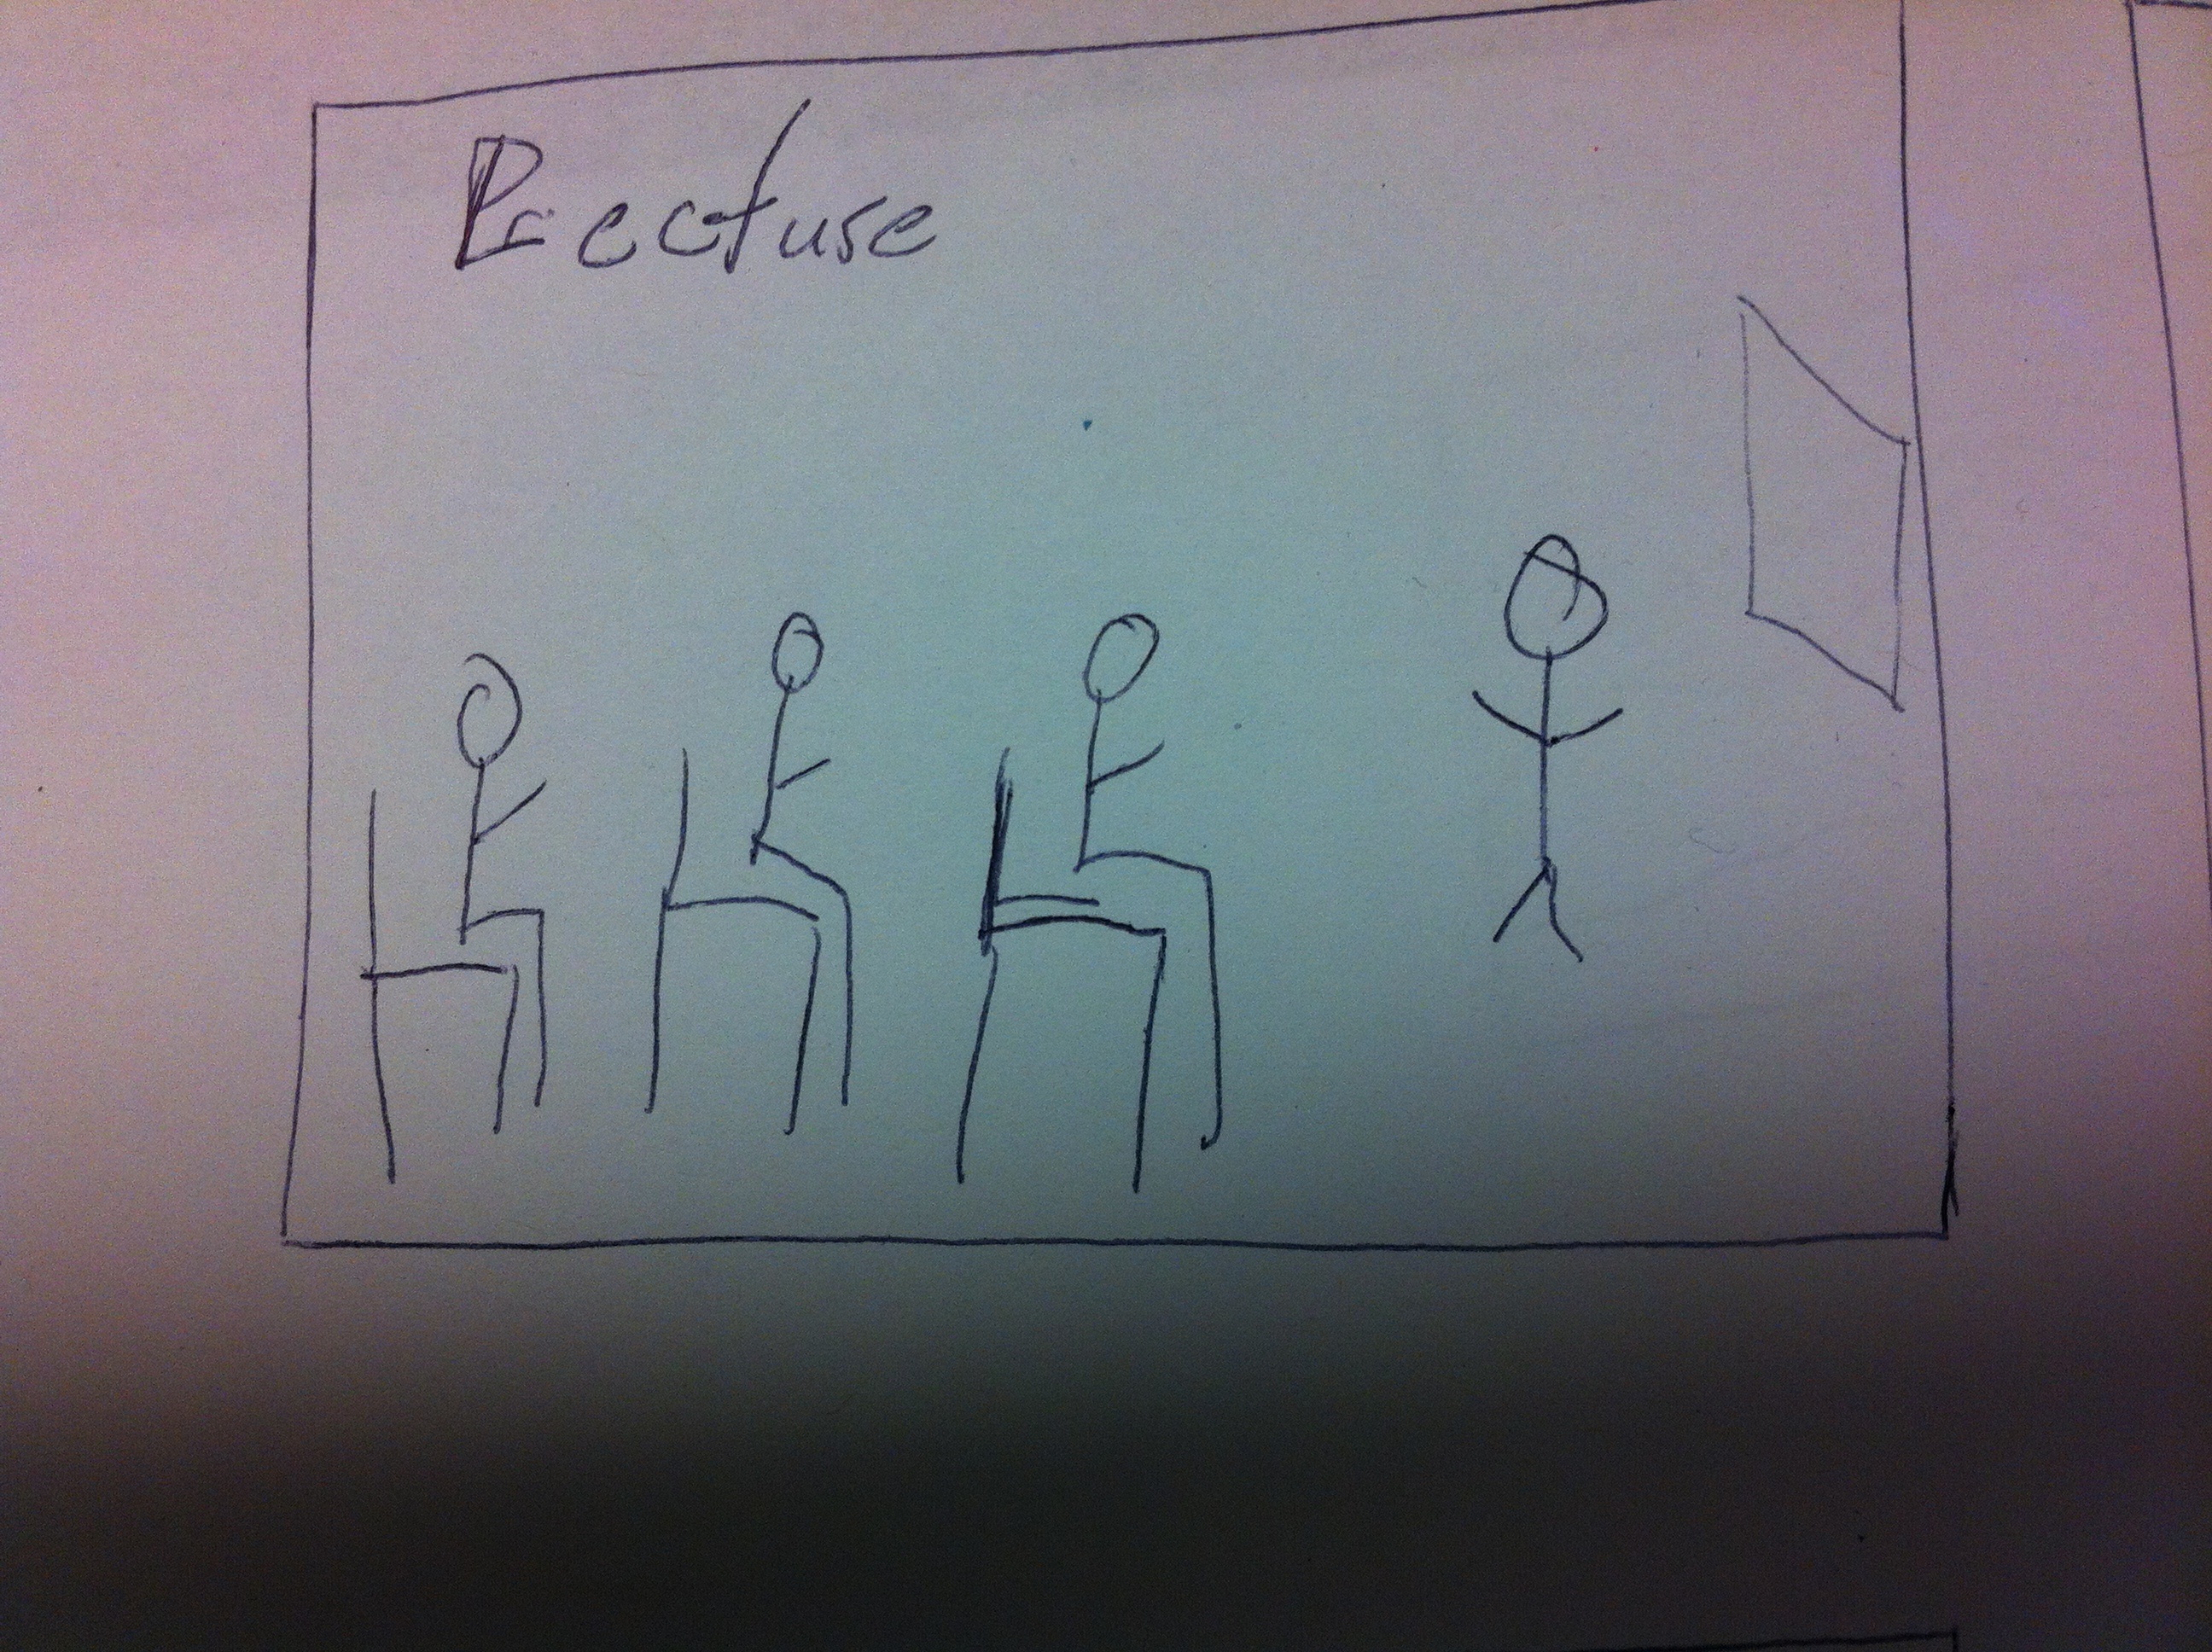
Overall setup
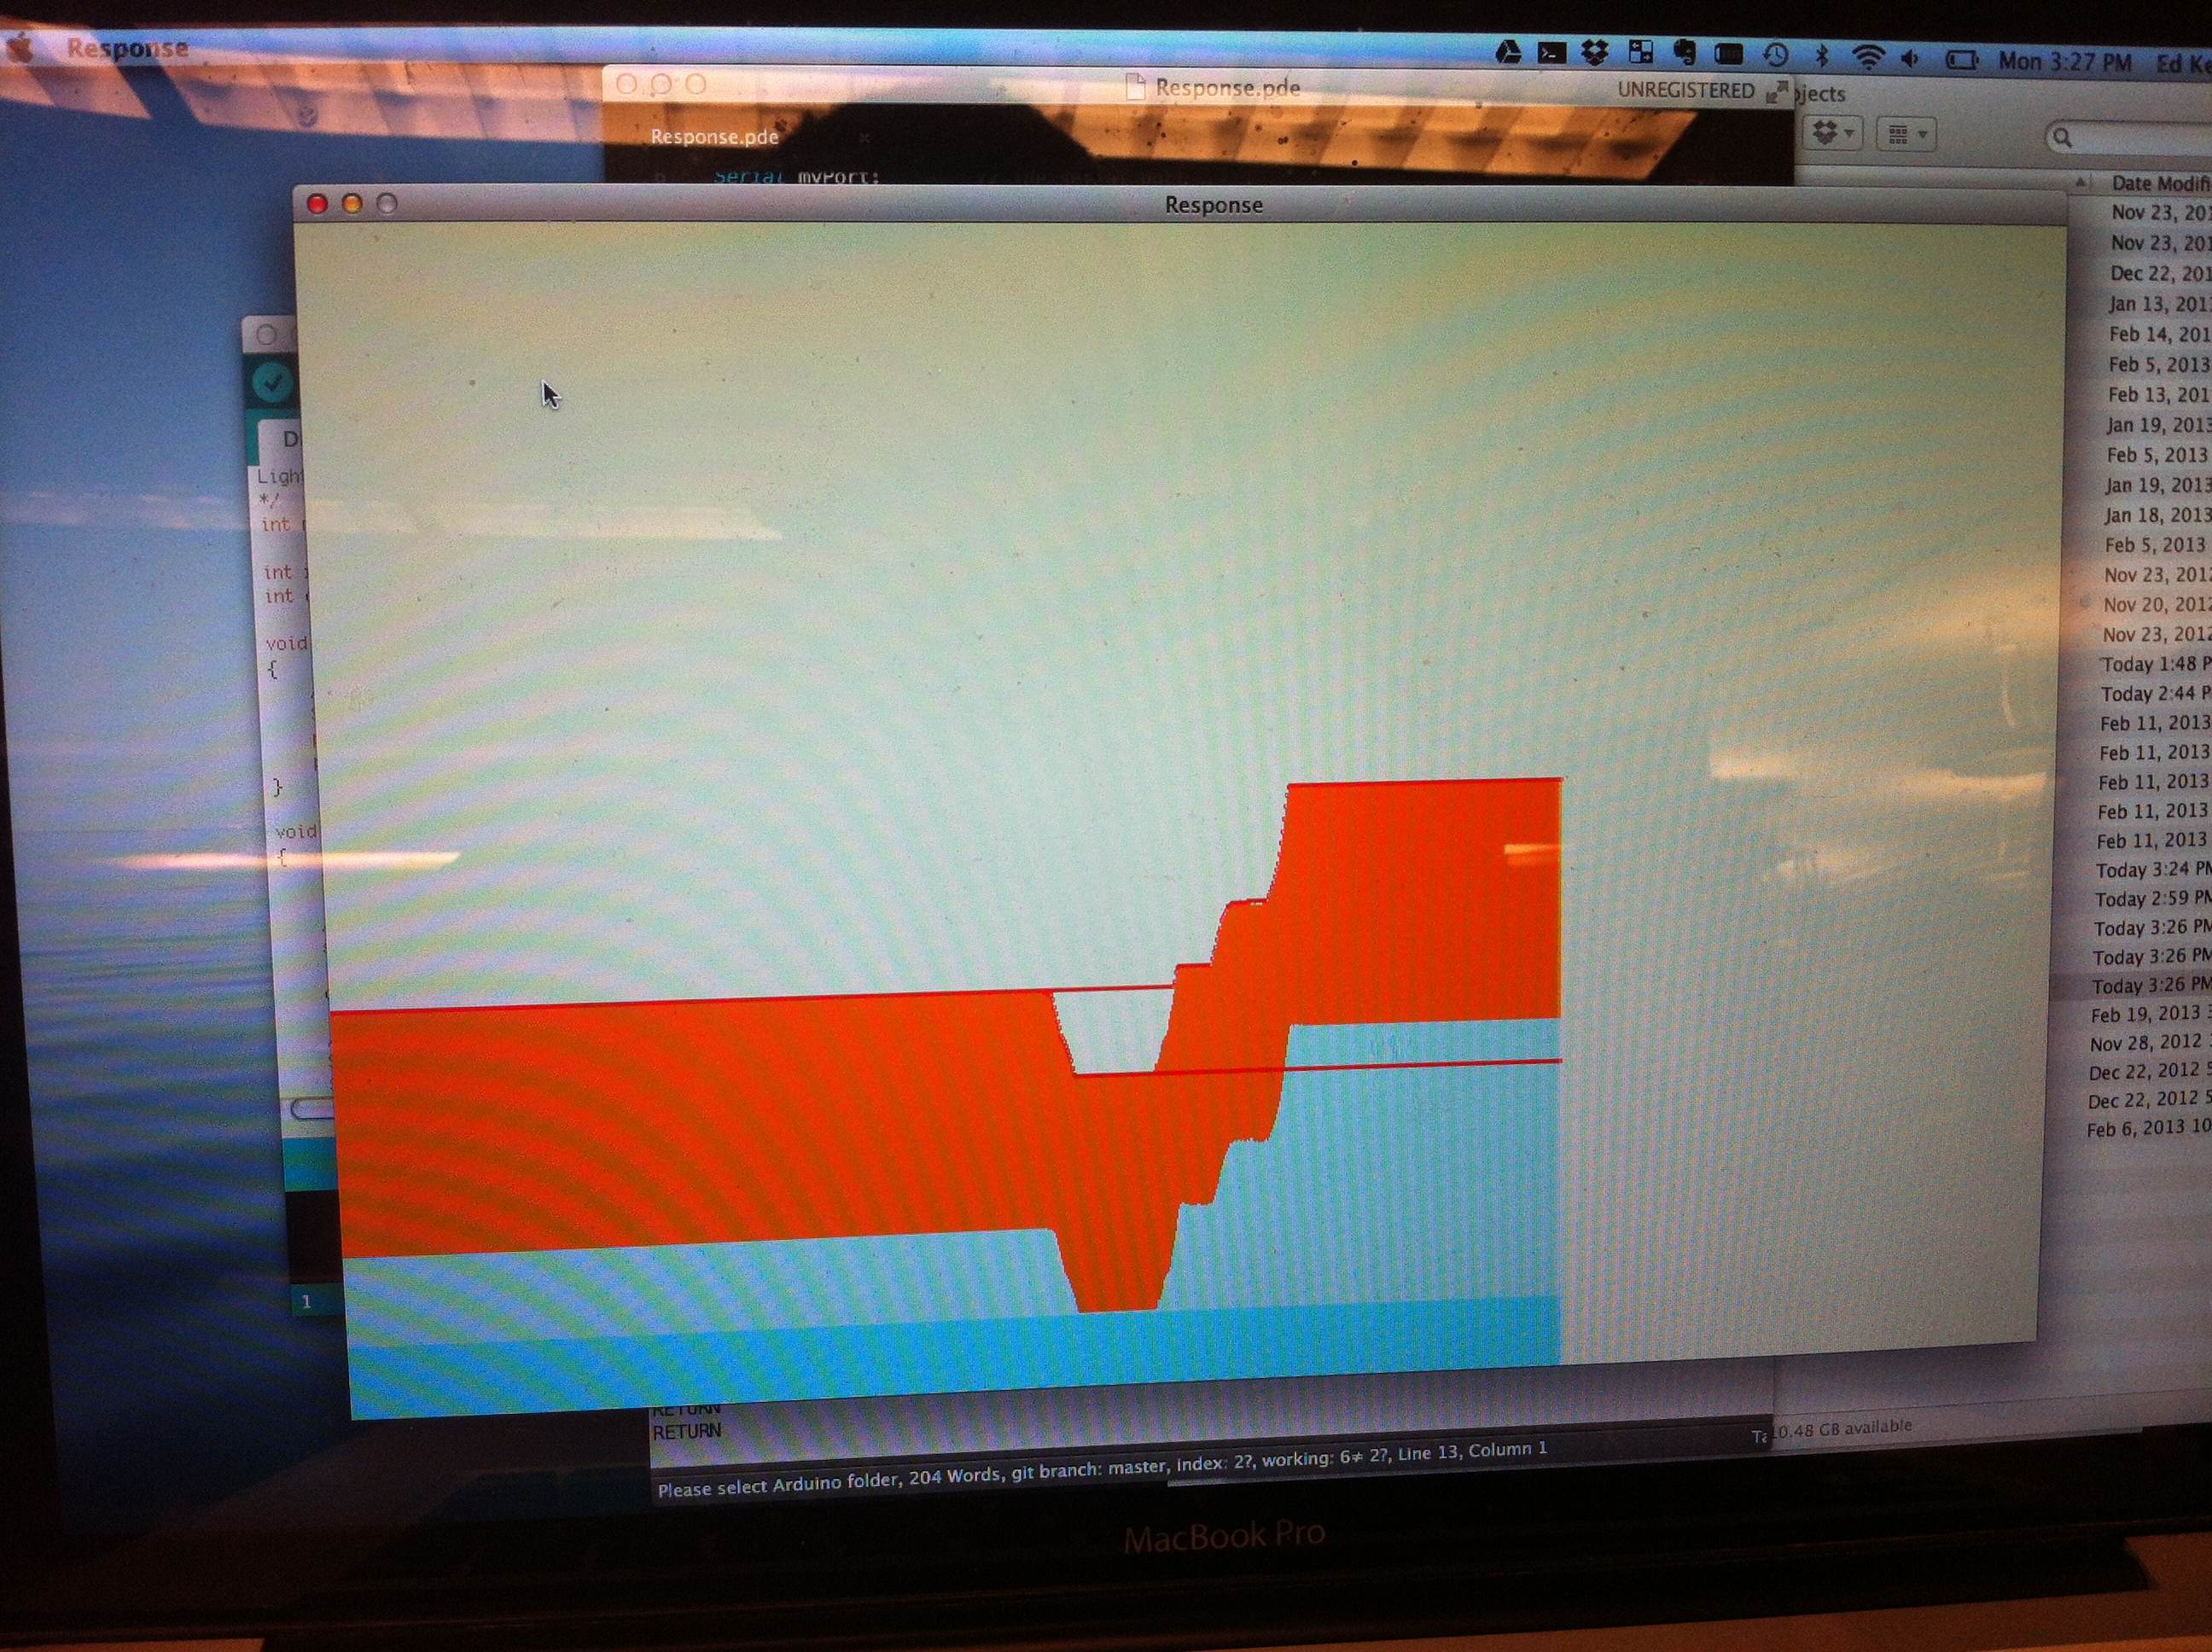
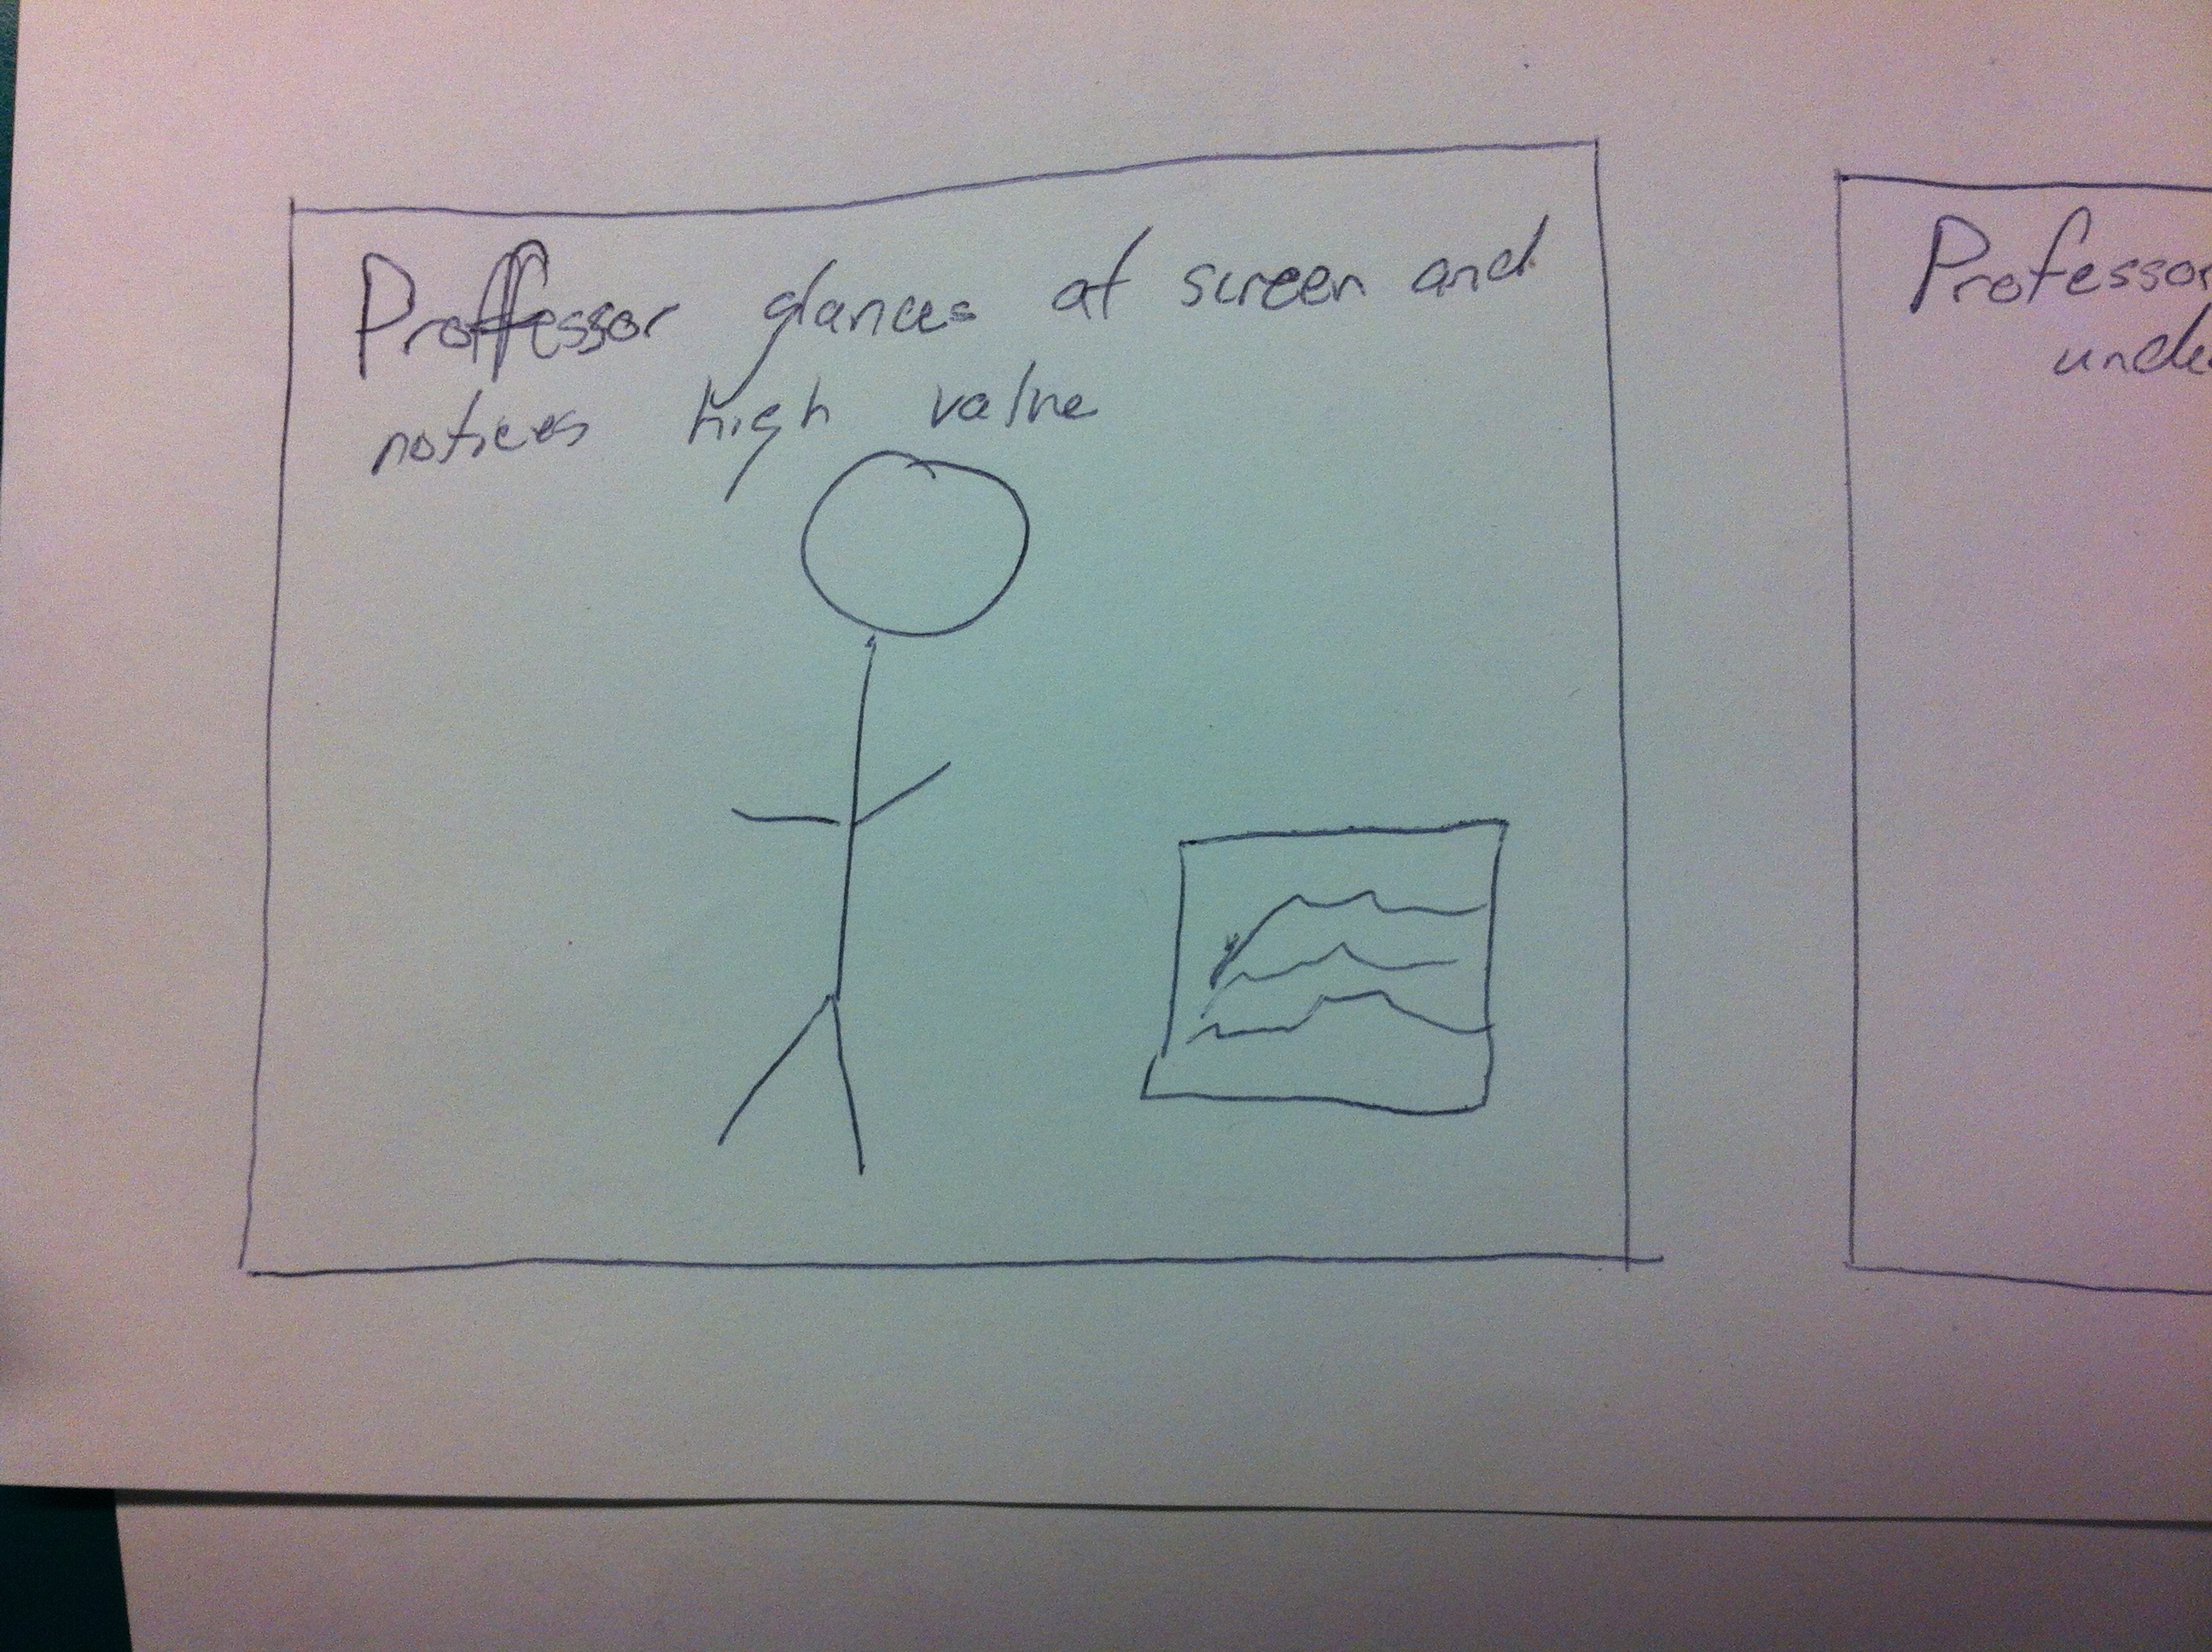
Display shown to teacher. Each color corresponds to the sensor readings from each individual student. The two red lines are the maximum and minimum levels of confusing in the frame.
http://www.youtube.com/watch?v=ZvxDd8jA7gs
Video
List of All Parts Used:
1 Arduino
Assorted Wires
1 Breadboard
3 Potentiometers
Directions:
The setup for our device is fairly simple. Take a potentiometer and connect the left pin to 5V, the middle pin to analog input A0, and the right pin to ground. Repeat this with two more potentiometers with their middle pins connected to analog inputs A1 and A2 respectively. The rest of the setup is done in software.
Code:
// Graphing sketch
//Adapted from http://arduino.cc/en/Tutorial/Graph

 import processing.serial.*;

 Serial myPort;        // The serial port
 int xPos = 1;         // horizontal position of the graph

 int zero_pos;
 int one_pos;
 float max_pos;
 float min_pos;


 void setup () {
	 // set the window size:
	 size(1080, 720);
	 max_pos = height;
	 min_pos = 0;

	 // List all the available serial ports
	 // println(Serial.list());
	 // I know that the first port in the serial list on my mac
	 // is always my  Arduino, so I open Serial.list()[0].
	 // Open whatever port is the one you're using.
	 myPort = new Serial(this, Serial.list()[0], 9600);
	 // don't generate a serialEvent() unless you get a newline character:
	 myPort.bufferUntil('\n');
	 // set inital background:
	 background(224,228,204);
 }
 void draw () {
 	// everything happens in the serialEvent()
 }

 void serialEvent (Serial myPort) {
	 // get the ASCII string:
	 String inString = myPort.readStringUntil('\n');

	 if (inString != null) {
		 // trim off any whitespace:
		 inString = trim(inString);

		if (inString.length() != 0) {
		 String[] sensor_strings = inString.split(" ");

		 if (sensor_strings.length < 3) {
		 	println("RETURN");
		 	return;
		 }

		float inByte = float(sensor_strings[0]);
		inByte = map(inByte, 0, 1023, 0, height/3);

		float yPos = height;
		// draw the line:
		stroke(105,210,231);
		line(xPos, yPos, xPos, yPos - inByte);
		yPos -= (inByte + 1);

		inByte = float(sensor_strings[1]);
		inByte = map(inByte, 0, 1023, 0, height/3);

		stroke(167,219,216);
		line(xPos, yPos, xPos, yPos - inByte);
		yPos -= (inByte + 1);


		inByte = float(sensor_strings[2]);
		inByte = map(inByte, 0, 1023, 0, height/3);

		stroke(250, 105, 0);
		line(xPos, yPos, xPos, yPos - inByte);


		if ((yPos-inByte)  min_pos) {
			min_pos = yPos-inByte;
		}
		drawMax(max_pos);
		drawMax(min_pos);


		 // at the edge of the screen, go back to the beginning:
		 if (xPos >= width) {
			 xPos = 0;
			 max_pos = yPos-inByte;
			 min_pos = yPos-inByte;
			 background(224,228,204);
		 }
		 else {
		 // increment the horizontal position:
		 xPos++;
		 }
		}
	 }
 }

 void drawMax(float max_pos) {
 	stroke(255, 0, 0);
 	ellipse(xPos, max_pos, 2, 2);
 }
Future Development:
In the future we would like to have the student sensors interact with the teacher’s computer without connecting by wires. Each student would also have multiple nobs so that the students can express different emotions.