Ice cores reveal a slow decline in atmospheric oxygen over the last 800,000 years (Science)

Princeton University researchers used ice cores collected in Greenland to study 800,000 years of atmospheric oxygen. Image source: Stolper, et al.
Princeton University researchers used ice cores collected in Greenland (pictured here) and Antarctica to study 800,000 years of atmospheric oxygen. Image source: Stolper, et al.

By Morgan Kelly, Office of Communications

Princeton University researchers have compiled 30 years of data to construct the first ice core-based record of atmospheric oxygen concentrations spanning the past 800,000 years, according to a paper published today in the journal Science.

The record shows that atmospheric oxygen has declined 0.7 percent relative to current atmospheric-oxygen concentrations, a reasonable pace by geological standards, the researchers said. During the past 100 years, however, atmospheric oxygen has declined by a comparatively speedy 0.1 percent because of the burning of fossil fuels, which consumes oxygen and produces carbon dioxide.

Curiously, the decline in atmospheric oxygen over the past 800,000 years was not accompanied by any significant increase in the average amount of carbon dioxide in the atmosphere, though carbon dioxide concentrations do vary over individual ice age cycles. To explain this apparent paradox, the researchers called upon a theory for how the global carbon cycle, atmospheric carbon dioxide and Earth’s temperature are linked on geologic timescales.

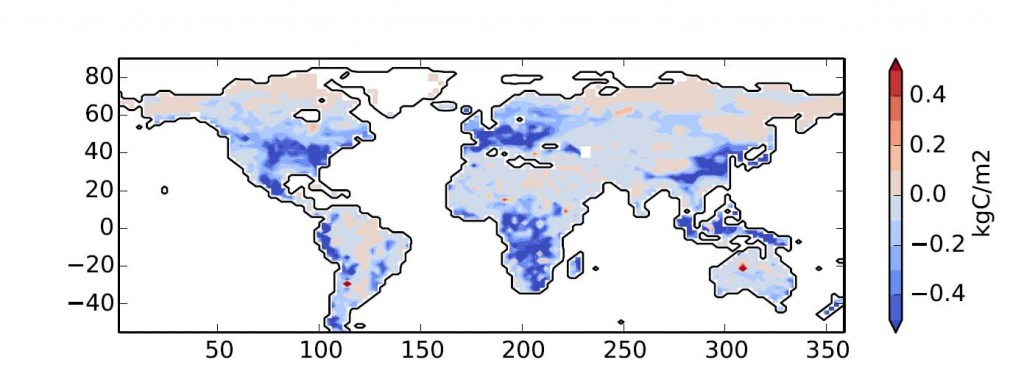
“The planet has various processes that can keep carbon dioxide levels in check,” said first author Daniel Stolper, a postdoctoral research associate in Princeton’s Department of Geosciences. The researchers discuss a process known as silicate weathering in particular, wherein carbon dioxide reacts with exposed rock to produce, eventually, calcium carbonate minerals, which trap carbon dioxide in a solid form. As temperatures rise due to higher carbon dioxide in the atmosphere, silicate-weathering rates are hypothesized to increase and remove carbon dioxide from the atmosphere faster.

Researchers at Princeton University analyzed ice cores collected in Greenland and Antarctica to determine levels of atmospheric oxygen over the last 800,000 years. (Image: Stolper, et al.)
Researchers at Princeton University analyzed ice cores collected in Greenland (pictured here) and Antarctica to determine levels of atmospheric oxygen over the last 800,000 years. (Image: Stolper, et al.)

Stolper and his co-authors suggest that the extra carbon dioxide emitted due to declining oxygen concentrations in the atmosphere stimulated silicate weathering, which stabilized carbon dioxide but allowed oxygen to continue to decline.

“The oxygen record is telling us there’s also a change in the amount of carbon dioxide [that was created when oxygen was removed] entering the atmosphere and ocean,” said co-author John Higgins, Princeton assistant professor of geosciences. “However, atmospheric carbon dioxide levels aren’t changing because the Earth has had time to respond via increased silicate-weathering rates.

“The Earth can take care of extra carbon dioxide when it has hundreds of thousands or millions of years to get its act together. In contrast, humankind is releasing carbon dioxide today so quickly that silicate weathering can’t possibly respond fast enough,” Higgins continued. “The Earth has these long processes that humankind has short-circuited.”

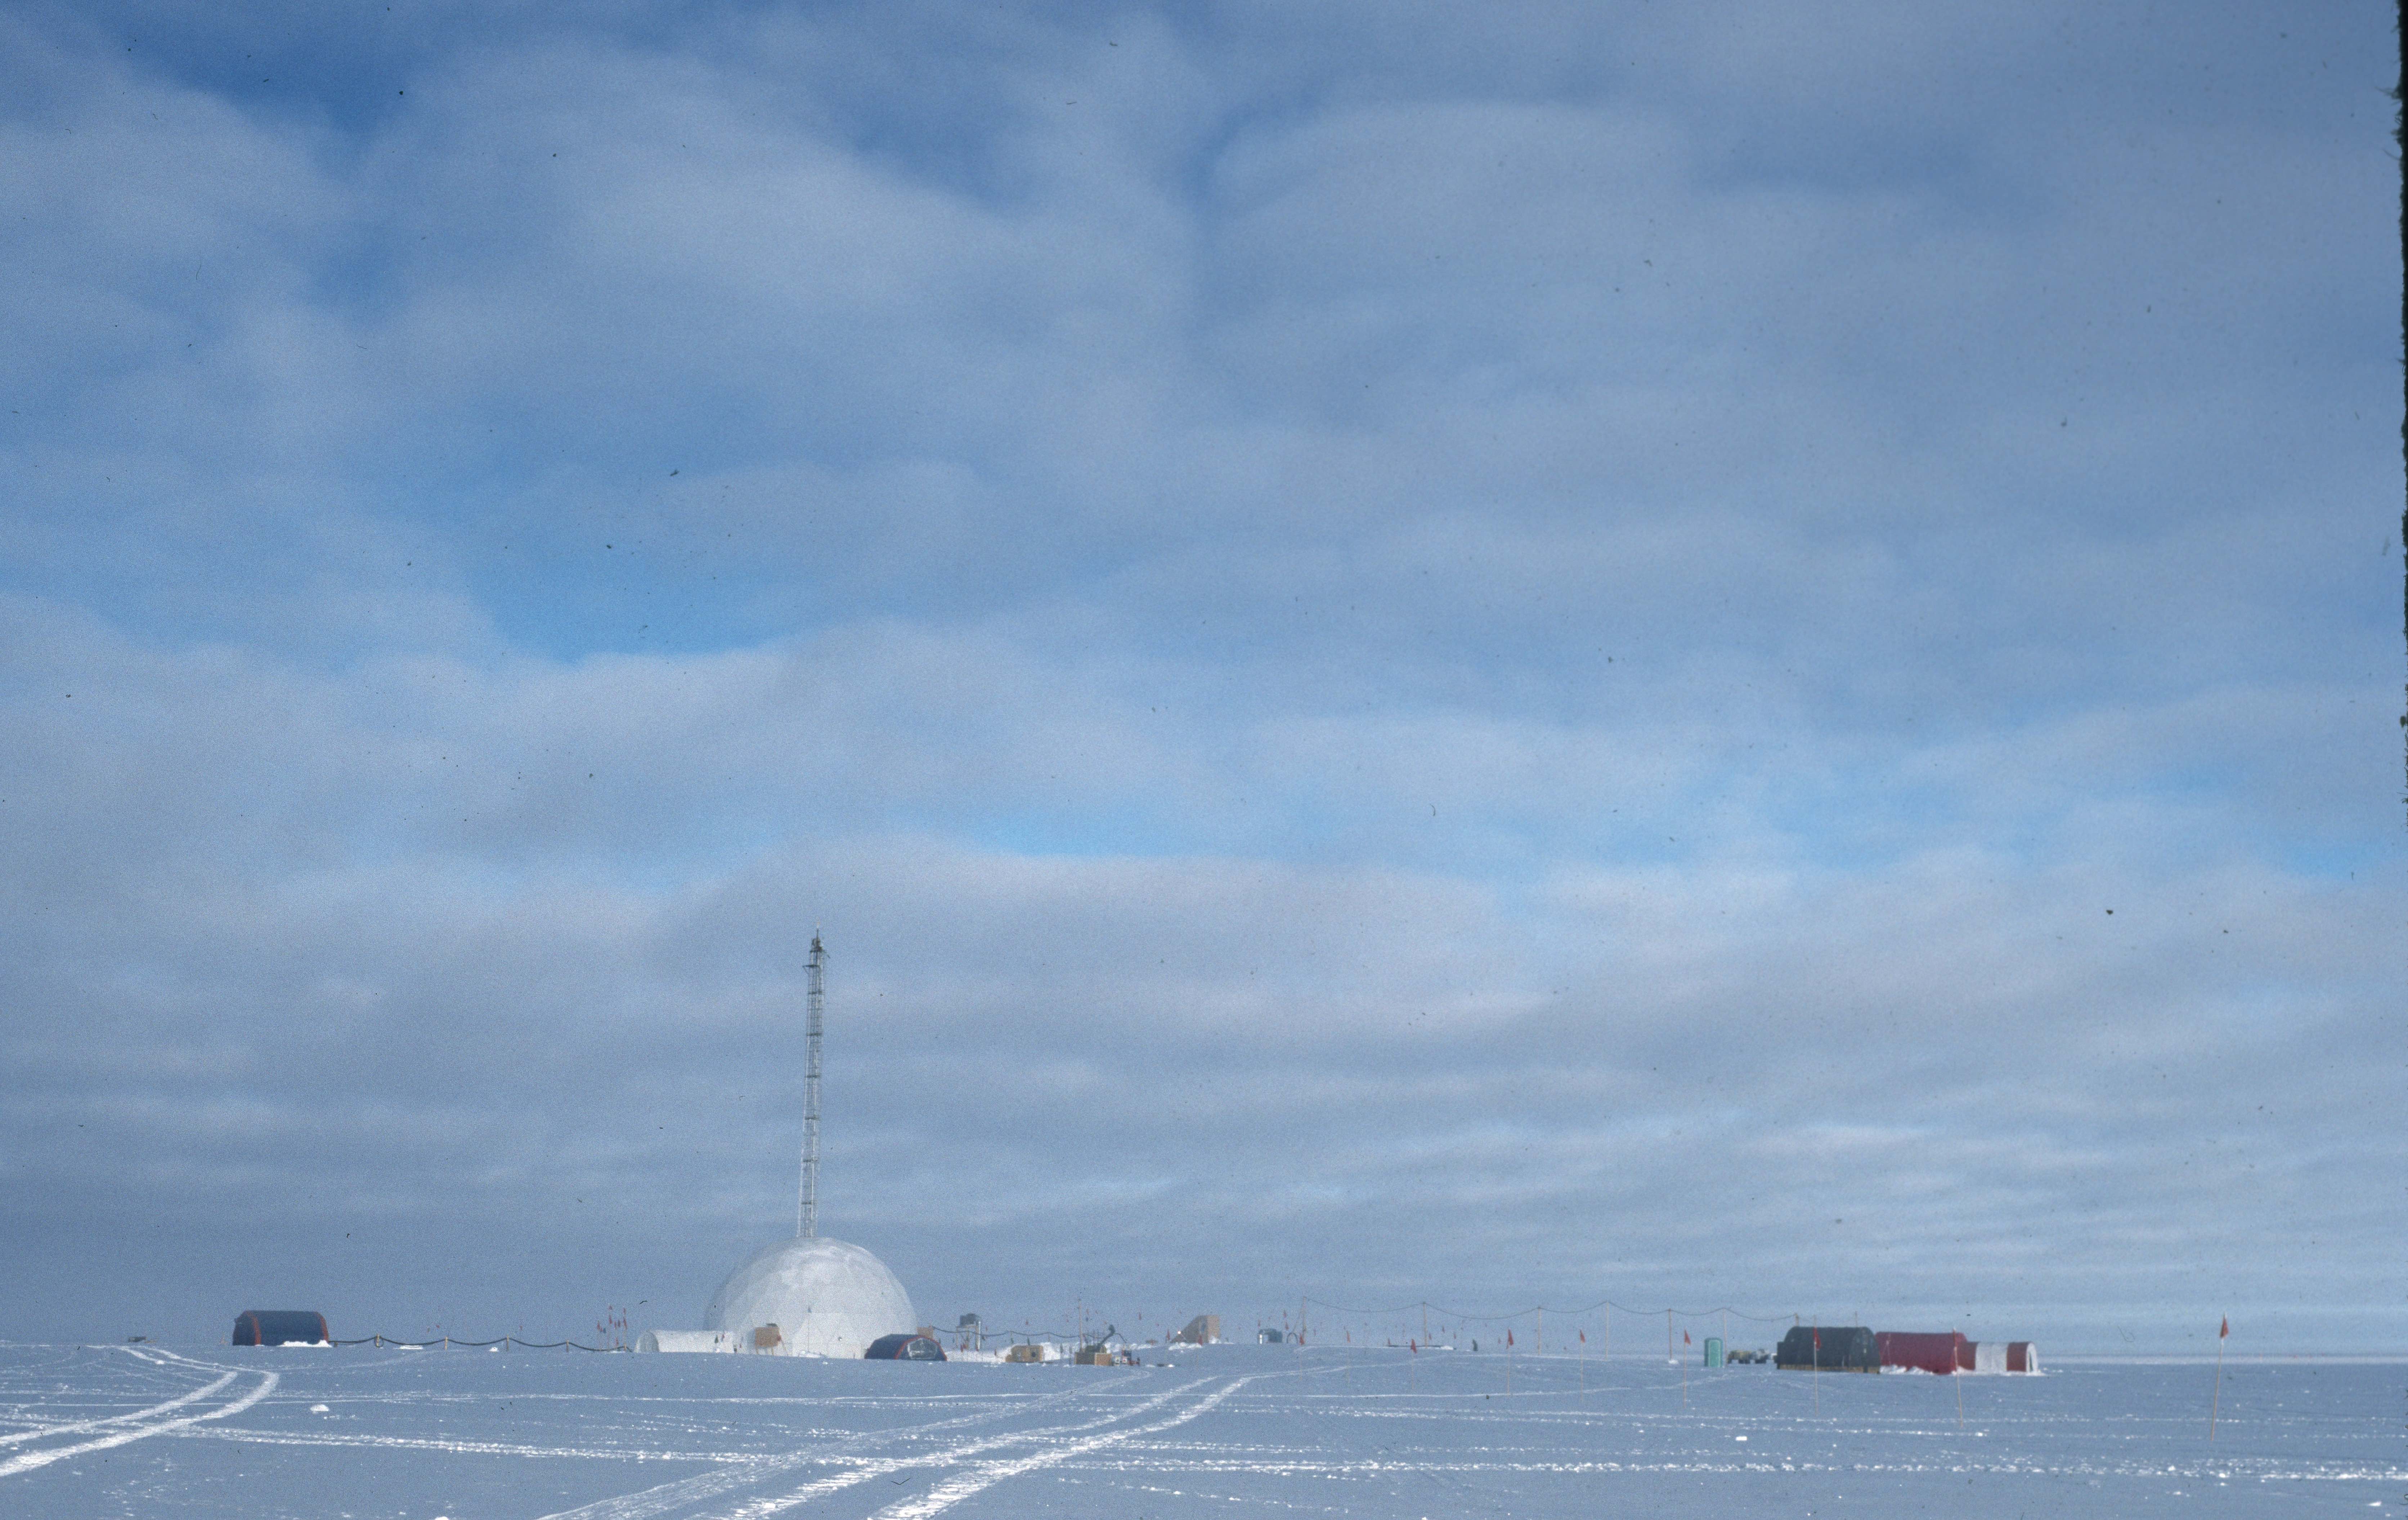
The researchers built their history of atmospheric oxygen using measured ratios of oxygen-to-nitrogen found in air trapped in Antarctic ice. This method was established by co-author Michael Bender, professor of geosciences, emeritus, at Princeton.

Because oxygen is critical to many forms of life and geochemical processes, numerous models and indirect proxies for the oxygen content in the atmosphere have been developed over the years, but there was no consensus on whether oxygen concentrations were rising, falling or flat during the past million years (and before fossil fuel burning). The Princeton team analyzed the ice-core data to create a single account of how atmospheric oxygen has changed during the past 800,000 years.

“This record represents an important benchmark for the study of the history of atmospheric oxygen,” Higgins said. “Understanding the history of oxygen in Earth’s atmosphere is intimately connected to understanding the evolution of complex life. It’s one of these big, fundamental ongoing questions in Earth science.”

Read the abstract

Daniel A. Stolper, Michael L. Bender, Gabrielle B. Dreyfus, Yuzhen Yan, and John A. Higgins. 2016. A Pleistocene ice core record of atmospheric oxygen concentrations. Science. Arti­cle pub­lished Sept. 22, 2016. DOI: 10.1126/science.aaf5445

The work was supported by a National Oceanic and Atmospheric Administration Climate and Global Change postdoctoral fellowship, and the National Science Foundation (grant no. ANT-1443263).

On warmer Earth, most of Arctic may remove, not add, methane (ISME Journal)

Arctic
McGill Arctic Research Station during late-spring at Expedition Fjord, Axel Heiberg Island, Nunavut, Canada. (Photo by Nadia Mykytczuk, Laurentian University)

By Morgan Kelly, Office of Communications

In addition to melting icecaps and imperiled wildlife, a significant concern among scientists is that higher Arctic temperatures brought about by climate change could result in the release of massive amounts of carbon locked in the region’s frozen soil in the form of carbon dioxide and methane. Arctic permafrost is estimated to contain about a trillion tons of carbon, which would potentially accelerate global warming. Carbon emissions in the form of methane have been of particular concern because on a 100-year scale methane is about 25-times more potent than carbon dioxide at trapping heat.

However, new research led by Princeton University researchers and published in The ISME Journal in August suggests that, thanks to methane-hungry bacteria, the majority of Arctic soil might actually be able to absorb methane from the atmosphere rather than release it. Furthermore, that ability seems to become greater as temperatures rise.

The researchers found that Arctic soils containing low carbon content — which make up 87 percent of the soil in permafrost regions globally — not only remove methane from the atmosphere, but also become more efficient as temperatures increase. During a three-year period, a carbon-poor site on Axel Heiberg Island in Canada’s Arctic region consistently took up more methane as the ground temperature rose from 0 to 18 degrees Celsius (32 to 64.4 degrees Fahrenheit). The researchers project that should Arctic temperatures rise by 5 to 15 degrees Celsius over the next 100 years, the methane-absorbing capacity of “carbon-poor” soil could increase by five to 30 times.

The researchers found that this ability stems from an as-yet unknown species of bacteria in carbon-poor Arctic soil that consume methane in the atmosphere. The bacteria are related to a bacterial group known as Upland Soil Cluster Alpha, the dominant methane-consuming bacteria in carbon-poor Arctic soil. The bacteria the researchers studied remove the carbon from methane to produce methanol, a simple alcohol the bacteria process immediately. The carbon is used for growth or respiration, meaning that it either remains in bacterial cells or is released as carbon dioxide.

First author Chui Yim “Maggie” Lau, an associate research scholar in Princeton’s Department of Geosciences, said that although it’s too early to claim that the entire Arctic will be a massive methane “sink” in a warmer world, the study’s results do suggest that the Arctic could help mitigate the warming effect that would be caused by a rising amount of methane in the atmosphere. In immediate terms, climate models that project conditions on a warmer Earth could use this study to more accurately calculate the future methane content of the atmosphere, Lau said.

“At our study sites, we are more confident that these soils will continue to be a sink under future warming. In the future, the Arctic may not have atmospheric methane increase as much as the rest of the world,” Lau said. “We don’t have a direct answer as to whether these Arctic soils will offset global atmospheric methane or not, but they will certainly help the situation.”

The researchers want to study the bacteria’s physiology as well as test the upper temperature threshold and methane concentrations at which they can still efficiently process methane, Lau said. Field observations showed that the bacteria are still effective up to 18 degrees Celsius (64.4 degrees Fahrenheit) and can remove methane down to one-quarter of the methane level in the atmosphere, which is around 0.5 parts-per-million.

“If these bacteria can still work in a future warmer climate and are widespread in other Arctic permafrost areas, maybe they could regulate methane for the whole globe,” Lau said. “These regions may seem isolated from the world, but they may have been doing things to help the world.”

From Princeton, Lau worked with geoscience graduate student and second author Brandon Stackhouse; Nicholas Burton, who received his bachelor’s degree in geosciences in 2013; David Medvigy, an assistant professor of geosciences; and senior author Tullis Onstott, a professor of geosciences. Co-authors on the paper were from the University of Tennessee-Knoxville; the Oak Ridge National Laboratory; McGill University; Laurentian University in Canada; and the University of Texas at Austin.

The research was supported by the U.S. Department of Energy, Office of Science, Office of Biological and Environmental Research (DE-SC0004902); the National Science Foundation (grant no. ARC-0909482); the Canada Foundation for Innovation (grant no. 206704); the Natural Sciences and Engineering Research Council of Canada Discovery Grant Program (grant no. 298520-05); and the Northern Research Supplements Program (grant no. 305490-05)

Read the abstract.

M.C.Y. Lau, B.T. Stackhouse, A.C. Layton, A. Chauhan, T. A. Vishnivetskaya, K. Chourey, J. Ronholm, N.C.S. Mykytczuk, P.C. Bennett, G. Lamarche-Gagnon, N. Burton, W.H. Pollard, C.R. Omelon, D.M. Medvigy, R.L. Hettich, S.M. Pfiffner, L.G. Whyte, and T.C. Onstott. 2015. An active atmospheric methane sink in high Arctic mineral cryosols. The ISME Journal. Article published in print August 2015. DOI:10.1038/ismej.2015.13.


Dirty pool: Soil’s large carbon stores could be freed by increased CO2, plant growth (Nature Climate Change)

By Morgan Kelly, Office of Communications

Soil carbon
Researchers based at Princeton University report that an increase in human-made carbon dioxide in the atmosphere could initiate a chain reaction between plants and microorganisms that would unsettle one of the largest carbon reservoirs on the planet — soil. The researchers developed the first computer model to show at a global scale the complex interaction between carbon, plants and soil. The model projected changes (above) in global soil carbon as a result of root-soil interactions, with blue indicating a greater loss of soil carbon to the atmosphere. (Image by Benjamin Sulman, Princeton Environmental Institute)

An increase in human-made carbon dioxide in the atmosphere could initiate a chain reaction between plants and microorganisms that would unsettle one of the largest carbon reservoirs on the planet — soil.

Researchers based at Princeton University report in the journal Nature Climate Change that the carbon in soil — which contains twice the amount of carbon in all plants and Earth’s atmosphere combined — could become increasingly volatile as people add more carbon dioxide to the atmosphere, largely because of increased plant growth. The researchers developed the first computer model to show at a global scale the complex interaction between carbon, plants and soil, which includes numerous bacteria, fungi, minerals and carbon compounds that respond in complex ways to temperature, moisture and the carbon that plants contribute to soil.

Although a greenhouse gas and pollutant, carbon dioxide also supports plant growth. As trees and other vegetation flourish in a carbon dioxide-rich future, their roots could stimulate microbial activity in soil that in turn accelerates the decomposition of soil carbon and its release into the atmosphere as carbon dioxide, the researchers found.

This effect counters current key projections regarding Earth’s future carbon cycle, particularly that greater plant growth could offset carbon dioxide emissions as flora take up more of the gas, said first author Benjamin Sulman, who conducted the modeling work as a postdoctoral researcher at the Princeton Environmental Institute.

“You should not count on getting more carbon storage in the soil just because tree growth is increasing,” said Sulman, who is now a postdoctoral researcher at Indiana University.

On the other hand, microbial activity initiated by root growth could lock carbon onto mineral particles and protect it from decomposition, which would increase long-term storage of carbon in soils, the researchers report.

Whether carbon emissions from soil rise or fall, the researchers’ model depicts an intricate soil-carbon system that contrasts starkly with existing models that portray soil as a simple carbon repository, Sulman said. An oversimplified perception of the soil carbon cycle has left scientists with a glaring uncertainty as to whether soil would help mitigate future carbon dioxide levels — or make them worse, Sulman said.

“The goal was to take that very simple model and add some of the most important missing processes,” Sulman said. “The main interactions between roots and soil are important and shouldn’t be ignored. Root growth and activity are such important drivers of what goes on in the soil, and knowing what the roots are doing could be an important part of understanding what the soil will be doing.”

The researchers’ soil-carbon cycle model has been integrated into the global land model used for climate simulations by the National Oceanic and Atmospheric Administration’s (NOAA) Geophysical Fluid Dynamics Laboratory (GFDL) located on Princeton’s Forrestal Campus.

Read the abstract

Benjamin N. Sulman, Richard P. Phillips, A. Christopher Oishi, Elena Shevliakova, and Stephen W. Pacala. 2014. Microbe-driven turnover offsets mineral-mediated storage of soil carbon under elevated CO2. Nature Climate Change. Arti­cle pub­lished in December 2014 print edition. DOI: 10.1038/nclimate2436

The work was supported by grants from NOAA (grant no. NA08OAR4320752); the U.S. Department of Agriculture (grant no. 2011-67003-30373); and Princeton’s Carbon Mitigation Initiative sponsored by BP.


Study resolves controversy over nitrogen’s ocean “exit strategies” (Science)

By Catherine Zandonella, Office of the Dean for Research

Seawater collection device
Princeton University graduate student Andrew Babbin (left) prepares a seawater collection device known as a rosette. The team used samples of seawater to determine how nitrogen is removed from the oceans. (Research photos courtesy of A. Babbin)

A decades-long debate over how nitrogen is removed from the ocean may now be settled by new findings from researchers at Princeton University and their collaborators at the University of Washington.

The debate centers on how nitrogen — one of the most important food sources for ocean life and a controller of atmospheric carbon dioxide — becomes converted to a form that can exit the ocean and return to the atmosphere where it is reused in the global nitrogen cycle.

Researchers have argued over which of two nitrogen-removal mechanisms, denitrification and anammox, is most important in the oceans. The question is not just a scientific curiosity, but has real world applications because one mechanism contributes more greenhouse gases to the atmosphere than the other.

Bess Ward
Bess Ward, Princeton’s William J. Sinclair Professor of Geosciences (Photo courtesy of Georgette Chalker)

“Nitrogen controls much of the productivity of the ocean,” said Andrew Babbin, first author of the study and a graduate student who works with Bess Ward, Princeton’s William J. Sinclair Professor of Geosciences. “Understanding nitrogen cycling is crucial to understanding the productivity of the oceans as well as the global climate,” he said.

In the new study, the researchers found that both of these nitrogen “exit strategies” are at work in the oceans, with denitrification mopping up about 70 percent of the nitrogen and anammox disposing of the rest.

The researchers also found that this 70-30 ratio could shift in response to changes in the quantity and quality of the nitrogen in need of removal. The study was published online this week in the journal Science.

The two other members of the research team were Richard Keil and Allan Devol, both professors at University of Washington’s School of Oceanography.

Research vessel
The researchers collected the samples in 2012 in the ocean off Baja California. Click on the image to read blog posts from a similar expedition that took place the following year.

Essential for the Earth’s life and climate, nitrogen is an element that cycles between soils and the atmosphere and between the atmosphere and the ocean. Bacteria near the surface help shuttle nitrogen into the ocean food chain by converting or “fixing” atmospheric nitrogen into forms that phytoplankton can use.

Without this fixed nitrogen, phytoplankton could not absorb carbon dioxide from the air, a feat which is helping to check today’s rising carbon dioxide levels in the atmosphere. When these tiny marine algae die or are consumed by predators, their biomass sinks to the ocean interior where it becomes food for other types of bacteria.

Test tubes
Researchers added specific amounts and types of nitrogen and organic compounds to test tubes containing seawater, and then noted whether denitrification or anammox occurred.

Until about 20 years ago, most scientists thought that denitrification, carried out by some of these bacteria, was the primary way that fixed nitrogen was recycled back to nitrogen gas. The second process, known as anaerobic ammonia oxidation, or anammox, was discovered by Dutch researchers studying how nitrogen is removed in sewage treatment plants.

Both processes occur in regions of the ocean that are naturally low in oxygen, or anoxic, due to local lack of water circulation and intense phytoplankton productivity overlying these regions. Within the world’s ocean, such regions occur only in the Arabian Sea, and off the coasts of Peru and Mexico.

In these anoxic environments, anaerobic bacteria feast on the decaying phytoplankton, and in the process cause the denitrification of nitrate into nitrogen gas, which cannot be used as a nutrient by most phytoplankton. During this process, ammonium is also produced, although marine geochemists had never been able to detect the ammonium that they knew must be there.

That riddle was solved in the early 2000s by the discovery of the anammox reaction in the marine environment, in which anaerobic bacteria feed on ammonium and convert it to nitrogen gas.

Glove bag
Graduate student Andrew Babbin filling incubation vials under an anoxic atmosphere in a transparent container called a “glove bag.” (Photo courtesy of Andrew Babbin)

But another riddle soon appeared: the anammox rates that Dutch and German teams of researchers measured in the oceans appeared to account for the entire nitrogen loss, leaving no role for denitrification.

Then in 2009, Ward’s team published a study in the journal Nature showing that denitrification was still a major actor in returning nitrogen to the air, at least in the Arabian Sea. The paper further fueled the controversy.

Back at Princeton, Ward suspected that both processes were necessary, with denitrification churning out the ammonium that anammox then converted to nitrogen gas.

To settle the issue, Ward and Babbin decided to look at exactly what was going on in anoxic ocean water when bacteria were given nitrogen and other nutrients to chew on.

They collected water samples from an anoxic region in the ocean south of Baja California and brought test tubes of the water into an on-ship laboratory. Working inside a sturdy, flexible “glove bag” to keep air from contaminating the low-oxygen water, Babbin added specific amounts and types of nitrogen and organic compounds to each test tube, and then noted whether denitrification or anammox occurred.

“We conducted a suite of experiments in which we added different types of organic matter, with variable ammonium content, to see if the ratio between denitrification and anammox would change,” said Babbin. “We found that not only did increased ammonia favor anammox as predicted, but that the precise proportions of nitrogen loss matched exactly as predicted based on the ammonium content.”

The explanation of why, in past experiments, some researchers found mostly denitrification while others found only anammox comes down to a sort-of “bloom and bust” cycle of phytoplankton life, explained Ward.

“If you have a big plankton bloom, then when those organisms die, a large amount of organic matter will sink and be degraded,” she said, “but we scientists are not always there to measure this. In other words, if you aren’t there on the day lunch is delivered, you won’t measure these processes.”

The researchers also linked the rates of nitrogen loss with the supply of organic material that drives the rates: more organic material equates to more nitrogen loss, so the quantity of the material matters too, Babbin said.

The two pathways have distinct metabolisms that turn out to be important in global climate change, he said.  “Denitrification produces carbon dioxide and both produces and consumes nitrous oxide, which is another major greenhouse gas and an ozone depletion agent,” he said. “Anammox, however, consumes carbon dioxide and has no known nitrous oxide byproduct. The balance between the two therefore has a significant impact on the production and consumption of greenhouse gases in the ocean.”

The research was funded by National Science Foundation grant OCE-1029951.

Read the abstract.

Andrew R. Babbin, Richard G. Keil, Allan H. Devol, and Bess B. Ward. Organic Matter Stoichiometry, Flux, and Oxygen Control Nitrogen Loss in the Ocean. Science. Published Online April 10 2014. DOI: 10.1126/science.1248364


Asian ozone pollution in Hawaii is tied to climate variability (Nature Geoscience)

Asian air pollution
Asian pollution drifts east toward North America in 2010. Hawaii is denoted by the star. (Source: Nature Geoscience)

By Joanne Curcio, Program in Atmospheric and Oceanic Sciences

Air pollution from Asia has been rising for several decades but Hawaii had seemed to escape the ozone pollution that drifts east with the springtime winds. Now a team of researchers has found that shifts in atmospheric circulation explain the trends in Hawaiian ozone pollution.

Ozone levels during autumn 1975-2012
Researchers found that ozone levels measured during autumn at Mauna Loa Observatory in Hawaii (black line) accurately reflect the trend in rising Asian air pollution from 1975 to 2012. The researchers demonstrated that the autumnal rise in ozone could be explained by atmospheric and climatic shifts over periods of decades. Using a chemistry-climate model, the researchers modeled this autumnal variation in ozone using constant (red) and time-varying (purple) emissions of ozone precursors. (Source: Nature Geoscience.)

The researchers found that since the mid-1990s, these shifts in atmospheric circulation have caused Asian ozone pollution reaching Hawaii to be relatively low in spring but rise significantly in autumn. The study, led by Meiyun Lin, an associate research scholar in the Program in Atmospheric and Oceanic Sciences (NOAA) at Princeton University and a scientist at the National Oceanic and Atmospheric Administration’s Geophysical Fluid Dynamics Laboratory, was published in Nature Geoscience.

“The findings indicate that decade-long variability in climate must be taken into account when attributing U.S. surface ozone trends to rising Asian emissions,” Lin said. She conducted the research with Larry Horowitz and Songmiao Fan of GFDL, Samuel Oltmans of the University of Colorado and the NOAA Earth System Research Laboratory in Boulder; and Arlene Fiore of the Lamont-Doherty Earth Observatory at Columbia University.

Although protective at high altitudes, ozone near the Earth’s surface is a greenhouse gas and a health-damaging air pollutant. The longest record of ozone measurements in the U.S. dates back to 1974 in Hawaii. Over the past few decades, emissions of ozone precursors in Asia has tripled, yet the 40-year Hawaiian record revealed little change in ozone levels during spring, but a surprising rise in autumn.

Through their research, Lin and her colleagues solved the puzzle. “We found that changing wind patterns ‘hide’ the increase in Asian pollution reaching Hawaii in the spring, but amplify the change in the autumn,” Lin said.

Using chemistry-climate models and observations, Lin and her colleagues uncovered the different mechanisms driving spring versus autumn changes in atmospheric circulation patterns. The findings indicate that the flow of ozone-rich air from Eurasia towards Hawaii during spring weakened in the 2000s as a result of La-Niña-like decadal cooling in the equatorial Pacific Ocean. The stronger transport of Asian pollution to Hawaii during autumn since the mid-1990s corresponds to a positive pattern of atmospheric circulation variability known as the Pacific-North American pattern.

“This study not only solves the mystery of Hawaiian ozone changes since 1974, but it also has broad implications for interpreting trends in surface ozone levels globally,” Lin said. “Characterizing shifts in atmospheric circulation is of paramount importance for understanding the response of surface ozone levels to a changing climate and evolving global emissions of ozone precursors,” she said.

The work was supported by NOAA’s Cooperative Institute for Climate Science at Princeton University. Ozone measurements were obtained at Mauna Loa Observatory, operated by NOAA’s Earth System Research Laboratory.

Read the abstract

Meiyun Lin, Larry W. Horowitz, Samuel J. Oltmans, Arlene M. Fiore, Songmiao Fan. Tropospheric ozone trends at Mauna Loa Observatory tied to decadal climate variability. Nature Geoscience, Published Online: 26 January, 2014, http://dx.doi.org/10.1038/ngeo2066.

Migrating animals add new depth to how the ocean “breathes” (Nature Geoscience)

By Morgan Kelly, Office of Communications

The oxygen content of the ocean may be subject to frequent ups and downs in a very literal sense — that is, in the form of the numerous sea creatures that dine near the surface at night then submerge into the safety of deeper, darker waters at daybreak.

Research begun at Princeton University and recently reported on in the journal Nature Geoscience found that animals ranging from plankton to small fish consume vast amounts of what little oxygen is available in the ocean’s aptly named “oxygen minimum zone” daily. The sheer number of organisms that seek refuge in water roughly 200- to 650-meters deep (650 to 2,000 feet) every day result in the global consumption of between 10 and 40 percent of the oxygen available at these depths.

The findings reveal a crucial and underappreciated role that animals have in ocean chemistry on a global scale, explained first author Daniele Bianchi, a postdoctoral researcher at McGill University who began the project as a doctoral student of atmospheric and oceanic sciences at Princeton.

Migration depth of sea animals
Research begun at Princeton University found that the numerous small sea animals that migrate from the surface to deeper water every day consume vast amounts of what little oxygen is available in the ocean’s aptly named “oxygen minimum zone” daily. The findings reveal a crucial and underappreciated role that animals have in ocean chemistry on a global scale. The figure above shows the various depths (in meters) that animals migrate to during the day to escape predators. Red indicates the shallowest depths of 200 meters (650 feet), and blue represents the deepest of 600 meters (2,000 feet). The black numbers on the map represent the difference (in moles, used to measure chemical content) between the oxygen at the surface and at around 500 meters deep, which is the best parameter for predicting migration depth. (Courtesy of Daniele Bianchi)

“In a sense, this research should change how we think of the ocean’s metabolism,” Bianchi said. “Scientists know that there is this massive migration, but no one has really tried to estimate how it impacts the chemistry of the ocean.

“Generally, scientists have thought that microbes and bacteria primarily consume oxygen in the deeper ocean,” Bianchi said. “What we’re saying here is that animals that migrate during the day are a big source of oxygen depletion. We provide the first global data set to say that.”

Much of the deep ocean can replenish (often just barely) the oxygen consumed during these mass migrations, which are known as diel vertical migrations (DVMs).

But the balance between DVMs and the limited deep-water oxygen supply could be easily upset, Bianchi said — particularly by climate change, which is predicted to further decrease levels of oxygen in the ocean. That could mean these animals would not be able to descend as deep, putting them at the mercy of predators and inflicting their oxygen-sucking ways on a new ocean zone.

“If the ocean oxygen changes, then the depth of these migrations also will change. We can expect potential changes in the interactions between larger guys and little guys,” Bianchi said. “What complicates this story is that if these animals are responsible for a chunk of oxygen depletion in general, then a change in their habits might have a feedback in terms of oxygen levels in other parts of the deeper ocean.”

The researchers produced a global model of DVM depths and oxygen depletion by mining acoustic oceanic data collected by 389 American and British research cruises between 1990 and 2011. Using the background readings caused by the sound of animals as they ascended and descended, the researchers identified more than 4,000 DVM events.

They then chemically analyzed samples from DVM-event locations to create a model that could correlate DVM depth with oxygen depletion. With that data, the researchers concluded that DVMs indeed intensify the oxygen deficit within oxygen minimum zones.

“You can say that the whole ecosystem does this migration — chances are that if it swims, it does this kind of migration,” Bianchi said. “Before, scientists tended to ignore this big chunk of the ecosystem when thinking of ocean chemistry. We are saying that they are quite important and can’t be ignored.”

Bianchi conducted the data analysis and model development at McGill with assistant professor of earth and planetary sciences Eric Galbraith and McGill doctoral student David Carozza. Initial research of the acoustic data and development of the migration model was conducted at Princeton with K. Allison Smith (published as K.A.S. Mislan), a postdoctoral research associate in the Program in Atmospheric and Oceanic Sciences, and Charles Stock, a researcher with the Geophysical Fluid Dynamics Laboratory operated by the National Oceanic and Atmospheric Administration.

Read the abstract

Citation: Bianchi, Daniele, Eric D. Galbraith, David A. Carozza, K.A.S. Milan and Charles A. Stock. 2013. Intensification of open-oxygen minimum zones by vertically migrating animals. Nature Geoscience. Article first published online: June 9, 2013. DOI:10.1038/ngeo1837

This work was supported in part by grants from the Canadian Institute for Advanced Research and the Princeton Carbon Mitigation Initiative.


Pebbles and sand on Mars best evidence that a river ran through it (Science)

NASA Pebbles on Mars
Pebble-rich rock slabs have been observed on Mars, suggesting the presence of an ancient stream bed (Source: Science)

By Morgan Kelly, Office of Communications

Pebbles and sand scattered near an ancient Martian river network may present the most convincing evidence yet that the frigid deserts of the Red Planet were once a habitable environment traversed by flowing water.

Scientists with NASA’s Mars Science Laboratory mission reported May 30 in the journal Science the discovery of sand grains and small stones that bear the telltale roundness of river stones and are too heavy to have been moved by wind. The researchers estimated that the sediment was produced by water that moved at a speed between that of a small stream and a large river, and had a depth of roughly an inch to nearly 3 feet.

Co-author Kevin Lewis, a Princeton associate research scholar in geosciences and a participating scientist on the Mars mission, said that the rocks and sand are among the best evidence so far that water once flowed on Mars, and suggest that the planet’s past climate was wildly different from what it is today.

“This is one of the best pieces of evidence we’ve seen on the ground for flowing water,” Lewis said. “The shape of these rocks and sand is exactly the same kind of thing you’d see if you went out to any streambed. It suggests a very similar environment to the Earth’s.”

The researchers analyzed sediment taken from a Martian plain that abuts a sedimentary deposit known as an alluvial fan. Alluvial fans are comprised of sediment leftover when a river spreads out over a plain then dries up, and are common on Earth in arid regions such as Death Valley.

Yet Death Valley is a refreshing spring compared to Mars today, Lewis said. Satellite images taken in preparation for the 2012 landing of NASA’s Curiosity Mars rover had revealed ancient river channels carved into the land on and around Mount Sharp, a 3.5-mile high mound similar in size to Alaska’s Mt. McKinley that would become the rover’s landing site. A major objective of the Curiosity mission is to explore Mars’ past habitability.

Nonetheless, liquid water itself is most likely rare on Mars’ currently cold and dusty landscape where wind is the dominant force. Lewis was co-author on a paper in the May 2013 edition of the journal Geology that suggested that Mount Sharp, thought to be the remnant of a massive lake, is most likely a giant dust pile produced by Mars’ violent, swirling winds.

Strong as it might be, however, wind cannot move sediment grains with a diameter larger than a few millimeters, Lewis said. The sand and stones he and his colleagues analyzed had diameters ranging from one to 40 millimeters, or roughly the size of a mustard seed to being only slightly smaller than a golf ball. The roundness of the sediment also suggested a prolonged eroding force, Lewis said.

“Once you get above a couple of millimeters the wind will not be able to mobilize sediment. A number of the grains we see in this outcrop are substantially bigger than that,” Lewis said. “That really leaves us with fluvial transport as the most likely process. We knew Curiosity was landing near the fan, but to land right on top of these rocks that suggest the presence of water was really fortuitous.”

If the sediment does mean a river ran through Mars, the researchers must next determine when, where it came from and how it dried up, a project that will be a “major scientific project over the coming year,” Lewis said. The mystery also centers on the potential relationship of the river to the scars on Mount Sharp: Did the river flow down it? Was the mound a source of water after all?

“This evidence tells us that there were a diverse set of geological processes happening at roughly the same time within the proximity of [the landing site], and it gives us a picture of a much more dynamic Mars than we see today,” Lewis said. “Finding out how exactly they relate will be an exciting story.”

Read the abstract.

Citation: Williams, R.M.E., et al. 2013. Martian fluvial conglomerates at Gale Crater. Science. Article first published online: May. 30, 2013. DOI: 10.1126/science.1237317

This work was supported in part by grants from NASA Mars Program Office.

How the ice ages ended (Nature)

by Catherine Zandonella, Office of the Dean for Research

Antarctica. Photo credit: Harley D. Nygren, NOAA

A study of sediment cores collected from the deep ocean supports a new explanation for how glacier melting at the end of the ice ages led to the release of carbon dioxide from the ocean.

The study published in Nature suggests that melting glaciers in the northern hemisphere caused a disruption of deep ocean currents, leading to the release of trapped carbon dioxide from the Southern Ocean around Antarctica.

Understanding what happened when previous glaciers melted could help climate researchers make accurate predictions about future global temperature increases and their effects on the planet.

The evidence is strong that ice ages are driven by periodic changes in the amount of sunlight reaching the poles due to cyclic changes in Earth’s rotation and orbit. Yet scientists have been puzzled by evidence that although the timing of ice ages are best explained by changes in sunlight in the northern part of the globe, the warming at the end of ice ages occurred first in the southern hemisphere, with a rise in carbon dioxide levels appearing to be cued from the south.

The new study suggests that changes in ocean currents, connecting the north to the south through the deep ocean, were to blame.

As glaciers melted in the northern reaches of the globe (far upper left), the influx of freshwater, which is naturally less dense than salt-laden ocean water, reduced the normally strong sinking of water in that region. This allowed silicate-rich deep water to rise upward into the shallower ocean waters (upward blue arrows), stimulating the production of opal by diatoms, while warm surface water mixed downward (red arrows) into the southern-sourced deep water. The rising silicate-rich water drew dense cold water from near Antarctica, yielding a cycle of water movement (in yellow). The new circulation pattern caused the carbon dioxide stored in the deep water to be released to the atmosphere near Antarctica (far upper right). Image source: Daniel Sigman.
As glaciers melted in the northern reaches of the globe (far upper left), the influx of freshwater, which is naturally less dense than salt-laden ocean water, caused a reduction in the normally strong sinking of water in that region. This allowed silicate-rich deep water to rise upward into the shallower ocean waters (upward blue arrows), stimulating the production of opal by diatoms, while warm surface water mixed downward (red arrows) into the southern-sourced deep water. The rising silicate-rich water drew dense cold water from near Antarctica, yielding a cycle of water movement (in yellow). The new circulation pattern caused carbon dioxide stored in the deep water to be released to the atmosphere near Antarctica (far upper right). Image source: Daniel Sigman.

Part of this story was suggested more than a decade ago and is already accepted by many climate scientists: As glaciers in the north started melting, the influx of fresh water diluted the salty waters that today flow to the north from the tropics as an extension of the Gulf Stream. Normally, these salty waters become cool and sink into the deep ocean, forming cold and dense water that flows southward, and allowing more salty tropical water to take its place in a sort of ocean conveyor belt. But the influx of fresh water due to melting glaciers stalled the conveyor belt.

So how did this lead to changes in the southern hemisphere?

The new research suggests that the shutdown in northern sinking water allowed southern-sourced water to fill up the deep Atlantic, setting up a new ocean circulation pattern. This new circulation pattern brought deep-sea water, which was rich in carbon dioxide due to sunken dead marine algae, to the surface near Antarctica, where the gas escaped into the atmosphere and acted to drive global warming.  (See diagram.)

The researchers included investigators from ETH Zürich, Princeton University, the University of Miami, the University of British Columbia, and the University of Bremen and the Alfred Wegener Institute in Germany. The Princeton effort was led by Daniel Sigman, the Dusenbury Professor of Geological and Geophysical Sciences.

The team tracked these historic movements of water through the study of sediment cores that are rich in silicon dioxide, or opal. Tiny marine algae known as diatoms make their cell walls out of opal, and when the organisms die, their opal remains sink to the deep sea bed.

The researchers looked at opal in sediment core samples drilled from deep beneath the ocean floor off the coast of northwest Africa and Antarctica. The team found that each period of glacier melting, which occurred five times over the last 550 thousand years, corresponded to a spike in the amount of the opal in the sediment, signaling an increase in diatom growth. The timing of the opal spikes provides evidence that the deep, opal-rich waters in the south were drawn to the surface in response to new meltwater entering the northern ocean.

The mechanism clashes with a previously offered explanation of why the melting of the northern glaciers, or deglaciations, leads to the release of ocean carbon dioxide from the Southern Ocean – the theory that the melting glaciers in the north increased southern hemisphere westerly winds, which in turn caused upwelling of Southern Ocean deep waters. “While distinguishing between these alternatives is important,” says Sigman, “the greater challenge is to test and understand a premise that is shared by both of these scenarios: that ice age conditions around Antarctica caused the deep ocean to be sluggish and rich in carbon dioxide. If this was really how the ice age ocean operated, then it calls for us to reconsider how we expect deep ocean circulation to respond to modern global warming.”

Read the abstract.

A. N. Meckler, D. M. Sigman, K. A. Gibson, R. François, A. Martínez-García, S. L. Jaccard, U. Röhl, L. C. Peterson, R. Tiedemann & G. H. Haug. 2013. Deglacial pulses of deep-ocean silicate into the subtropical North Atlantic Ocean. Nature 495 (7442), 495-498. doi:10.1038/nature12006. Published online 27 March, 2013.

This research used samples provided by the ODP, which is sponsored by the US National Science Foundation (NSF) and participating countries under the management of the Joint Oceanographic Institutions. XRF data were acquired at the XRF Core Scanner Lab at MARUM – Center for Marine Environmental Sciences, University of Bremen, with support from the DFG-Leibniz Center for Surface Process and Climate Studies at the University of Potsdam. Further support was provided by the US NSF through grant OCE-1060947 to D.M.S. and by NSERC and CFCAS to R.F.

New approach can rapidly estimate damage from earthquakes (Bulletin of the Seismological Society of America)

A new approach that can rapidly estimate damage to tall buildings following a large earthquake has been developed by researchers. The approach involves creating a database of building responses to typical earthquake-related ground motions. After an earthquake, an analysis of the ground motions can indicate what type of damage is likely to have occurred to nearby buildings. The results could be useful for emergency response decision making.

Swaminathan Krishnan, Emanuele Casarotti, Jim Goltz, Chen Ji, Dimitri Komatitsch, Ramses Mourhatch, Matthew Muto, John H. Shaw, Carl Tape, and Jeroen Tromp. Rapid Estimation of Damage to Tall Buildings Using Near Real‐Time Earthquake and Archived Structural Simulations. Bulletin of the Seismological Society of America. 2012; 102:2646-2666.

Read the abstract.

Changes in Greenland ice sheet over space and time (PNAS)

Polar ice sheets are melting and contributing to a global rise in sea-level. This study looked at changes in Greenland’s ice sheet from April 2002 to August 2011 and found that active areas of ice loss were concentrated on the southeastern and northwestern coasts, with ice mass in the center of Greenland steadily increasing over the decade.

Christopher Harig and Frederik J. Simons. Mapping Greenland’s mass loss in space and time. Proceedings of the National Academy of Sciences. Published online before print November 19, 2012, doi: 10.1073/pnas.1206785109

Read the abstract.