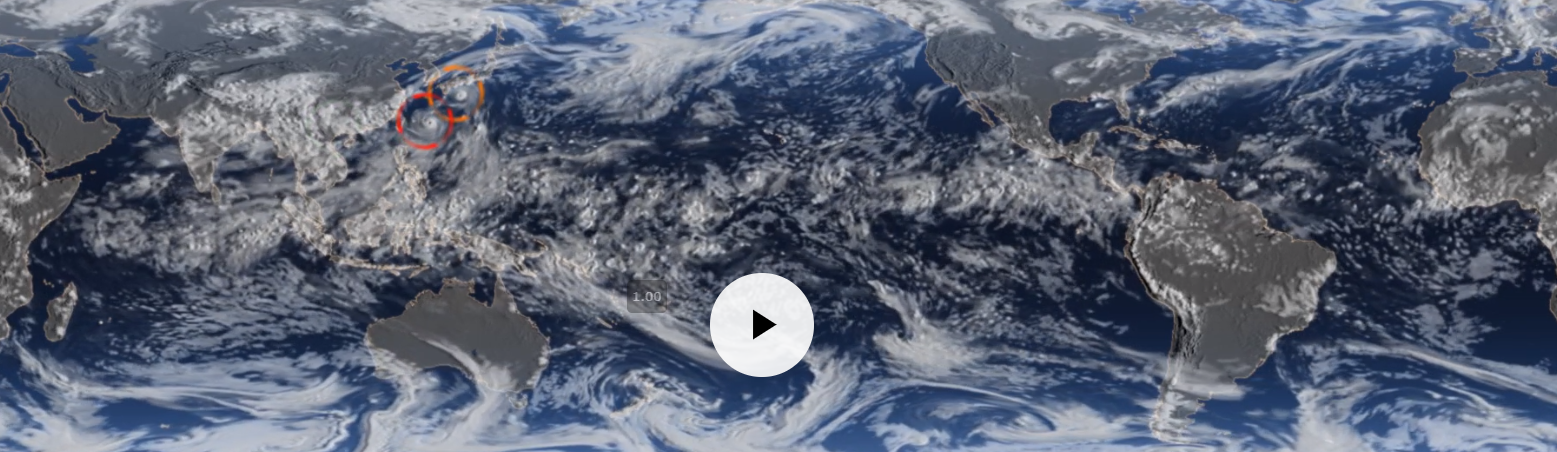
Clouds from a HiFLOR global model simulation, showing three hurricanes in the Atlantic and one in West Pacific (Figure Remik Ziemlinski)
New NOAA research that looks at the devastating 2017 Atlantic hurricane season projects that if similar weather conditions occur in the future, it’s likely that the number of major hurricanes (category 3 and higher) would increase by two in a similar active year at the end of century.
This increase would be driven by predicted climate warming, according to the research appearing today in Science.
Last year’s six major Atlantic hurricanes included landfalling hurricanes Harvey, Irma and Maria that unleashed destruction on and caused loss of life in communities across Texas, Florida and Puerto Rico. The three hurricanes caused an estimated $265 billion in damages during a year that shattered all records for U.S. economic losses due to severe weather.
Global model identifies climate influence
Hiroyuki Murakami. Photo by Maria Setzer
Using a high-resolution global climate model called HiFLOR, developed at GFDL, scientists were able to accurately predict the active hurricane season in June 2017. Scientists then conducted additional experiments with HiFLOR that found it was a remarkably warm tropical Atlantic Ocean, relative to the global tropical ocean, which was the main driver of 2017 hurricane activity.
“This new method allows us to predict hurricane activity as the season is happening as well as take into consideration the likely contribution of climate warming,” said Murakami, a climate researcher at GFDL. NOAA scientists use ocean temperature data showing the relative warmth of the tropical Atlantic to help create vital hurricane season outlooks.
In addition to Murakami, the research team included Emma Levin of Paul D. Schreiber High School in Port Washington, NY, Thomas Delworth and Richard Gudgel of GFDL, and Pang-Chi Hsu of Nanjing University of Information Science and Technology, China.
The study, “Dominant Effect of Relative Tropical Atlantic Warming on Major Hurricane Occurrence,” by H. Murakami, E. Levin, T. L. Delworth, R. Gudgel and P-C Hsu, was published in the journal Science on Sept. 27, 2018.
Funding for this study was provided by the National Oceanic and Atmospheric Administration (NOAA).
Deep sea corals reveal that efficient nutrient consumption by plankton drove carbon sequestration in the deep ocean during the ice ages. Photo courtesy of Caltech.
By Robert Perkins, Caltech
We know a lot about how carbon dioxide (CO2) levels can drive climate change, but how about the way that climate change can cause fluctuations in CO2 levels? New research from an international team of scientists reveals one of the mechanisms by which a colder climate was accompanied by depleted atmospheric CO2 during past ice ages.
The overall goal of the work is to better understand how and why the earth goes through periodic climate change, which could shed light on how man-made factors could affect the global climate.
Now, an international team of scientists has shown that periods of colder climates are associated with higher phytoplankton efficiency and a reduction in nutrients in the surface of the Southern Ocean (the ocean surrounding the Antarctic), which is related to an increase in carbon sequestration in the deep ocean. A paper about their research appears this week in the online edition of the Proceedings of the National Academy of Sciences.
“It is critical to understand why atmospheric CO2 concentration was lower during the ice ages. This will help us understand how the ocean will respond to ongoing anthropogenic CO2 emissions,” says Xingchen (Tony) Wang, lead author of the study. Wang was a graduate student at Princeton University while conducting the research in the lab of Daniel Sigman, the Dusenbury Professor of Geological and Geophysical Sciences. Wang is now a Simons Foundation Postdoctoral Fellow on the Origins of Life at Caltech. The study used a library of 10,000 deep-sea corals collected by Caltech’s Jess Adkins.
Xingchen (Tony) Wang and Jess Adkins. Photo courtesy of Caltech
Earth’s average temperature has naturally fluctuated by about 4 to 5 degrees Celsius over the course of the past million years as the planet has cycled in and out of glacial periods. During that time, the earth’s atmospheric CO2 levels have fluctuated between roughly 180 and 280 parts per million (ppm) every 100,000 years or so. (In recent years, man-made carbon emissions have boosted that concentration up to over 400 ppm.)
About 10 years ago, researchers noticed a close correspondence between the fluctuations in CO2 levels and in temperature over the last million years. When the earth is at its coldest, the amount of CO2 in the atmosphere is also at its lowest. During the most recent ice age, which ended about 11,000 years ago, global temperatures were 5 degrees Celsius lower than they are today, and atmospheric CO2 concentrations were at 180 ppm.
There is 60 times more carbon in the ocean than in the atmosphere—partly because the ocean is so big. The mass of the world’s oceans is roughly 270 times greater than that of the atmosphere. As such, the ocean is the greatest regulator of carbon in the atmosphere, acting as both a sink and a source for atmospheric CO2.
Biological processes are the main driver of CO2 absorption from the atmosphere to the ocean. Just like photosynthesizing trees and plants on land, plankton at the surface of the sea turn CO2 into sugars that are eventually consumed by other creatures. As the sea creatures who consume those sugars—and the carbon they contain—die, they sink to the deep ocean, where the carbon is locked away from the atmosphere for a long time. This process is called the “biological pump.”
A healthy population of phytoplankton helps lock away carbon from the atmosphere. In order to thrive, phytoplankton need nutrients—notably, nitrogen, phosphorus, and iron. In most parts of the modern ocean, phytoplankton deplete all of the available nutrients in the surface ocean, and the biological pump operates at maximum efficiency.
However, in the modern Southern Ocean, there is a limited amount of iron—which means that there are not enough phytoplankton to fully consume the nitrogen and phosphorus in the surface waters. When there is less living biomass, there is also less that can die and sink to the bottom—which results in a decrease in carbon sequestration. The biological pump is not currently operating as efficiently as it theoretically could.
To track the efficiency of the biological pump over the span of the past 40,000 years, Adkins and his colleagues collected more than 10,000 fossils of the coral Desmophyllum dianthus.
Why coral? Two reasons: first, as it grows, coral accretes a skeleton around itself, precipitating calcium carbonate (CaCO3) and other trace elements (including nitrogen) out of the water around it. That process creates a rocky record of the chemistry of the ocean. Second, coral can be precisely dated using a combination of radiocarbon and uranium dating.
“Finding a few centimeter-tall fossil corals 2,000 meters deep in the ocean is no trivial task,” says Adkins, the Smits Family Professor of Geochemistry and Global Environmental Science at Caltech.
Adkins and his colleagues collected coral from the relatively narrow (500-mile) gap known as the Drake Passage between South America and Antarctica (among other places). Because the Southern Ocean flows around Antarctica, all of its waters funnel through that gap—making the samples Adkins collected a robust record of the water throughout the Southern Ocean.
Coauthors include scientists from Caltech, Princeton University, Pomona College, the Max Planck Institute for Chemistry in Germany, University of Bristol, and ETH Zurich in Switzerland.
Wang analyzed the ratios of two isotopes of nitrogen atoms in these corals – nitrogen-14 (14N, the most common variety of the atom, with seven protons and seven neutrons in its nucleus) and nitrogen-15 (15N, which has an extra neutron). When phytoplankton consume nitrogen, they prefer 14N to 15N. As a result, there is a correlation between the ratio of nitrogen isotopes in sinking organic matter (which the corals then eat as it falls to the seafloor) and how much nitrogen is being consumed in the surface ocean—and, by extension, the efficiency of the biological pump.
A higher amount of 15N in the fossils indicates that the biological pump was operating more efficiently at that time. An analogy would be monitoring what a person eats in their home. If they are eating more of their less-liked foods, then one could assume that the amount of food in their pantry is running low.
Indeed, Wang found that higher amounts of 15N were present in fossils corresponding to the last ice age, indicating that the biological pump was operating more efficiently during that time. As such, the evidence suggests that colder climates allow more biomass to grow in the surface Southern Ocean—likely because colder climates experience stronger winds, which can blow more iron into the Southern Ocean from the continents. That biomass consumes carbon, then dies and sinks, locking it away from the atmosphere.
Adkins and his colleagues plan to continue probing the coral library for further details about the cycles of ocean chemistry changes over the past several hundred thousand years.
The research was funded by the National Science Foundation, Princeton University, the European Research Council, and the Natural Environment Research Council.
The study, “Deep-sea coral evidence for lower Southern Ocean surface nitrate concentrations during the last ice age,” Xingchen Tony Wang, Daniel M. Sigman, Maria G. Prokopenko, Jess F. Adkins, Laura F. Robinson, Sophia K. Hines, Junyi Chai, Anja S. Studer, Alfredo Martínez-García, Tianyu Chen, and Gerald H. Haug, was published in the journal Proceedings of the National Academy of Sciences early edition the week of March 13, 2017. doi: 10.1073/pnas.1615718114
People commonly perceive mountain ranges as jumbles of pyramid-shaped masses that steadily narrow as they slope upward.
While that’s certainly how they appear from a ground-level human viewpoint, a new study shows that pyramid-shaped mountains are not only a minority in nature, but also that most ranges actually increase in area at higher elevations. Besides reshaping the mountains in our mind’s eye, the findings could lead scientists to reconsider conservation strategies — which are often based on misconceptions about mountain terrain — for mountain animal species threatened by climate change.
Researchers at Princeton University and the University of Connecticut conducted the first study to map the shape of the world’s major mountain ranges and found that the classic triangular form in which land-area uniformly decreases as elevation increases only applies to roughly one-third of the world’s mountain ranges, according to a report in the journal Nature Climate Change.
Instead, the 182 mountain ranges the researchers studied take on four principal shapes: diamond, pyramid, inverted pyramid and hourglass. The researchers analyzed high-resolution topography maps for every mountain range to determine land area by elevation. They found that for all the range shapes except pyramid, land availability can be greater at higher elevations than it is farther down the mountainside.
The researchers found that the 182 mountain ranges they studied have four principal shapes. Diamond-shaped ranges such as the Rocky Mountains (a) increase in land area from the bottom until mid-elevation before contracting quickly. Pyramid-shaped mountains such as the Alps (b) have sides that rise sharply and consistently decrease in area the higher they go. The Kunlun Mountains (c) of China take the form of inverse pyramids, which gradually expand in area as elevation increases before suddenly widening toward their peaks. For hourglass-shaped mountain ranges such as the Himalayas (d), land area rises slightly then decreases at mid-elevations before increasing sharply at higher elevations. The three-dimensional images (second row) represent each range shape as viewed from the side. Moving from bottom to top, the width of the shape changes to represent an increase or decrease in area at a specific elevation. Elevation spans from zero to more than 8,685 meters (28,494 feet), and is denoted by the color scale from blue (lowest elevation) to brown (highest elevation). (Image by Paul Elsen, Princeton University Department of Ecology and Evolutionary Biology; Morgan Tingley, University of Connecticut; and Mike Costelloe)
Yet, people’s idea that land area steadily shrinks as a mountain rises is so entrenched that it has come to guide conservation plans and research related to climate change, said first author Paul Elsen, a Princeton graduate student of ecology and evolutionary biology. Scientists project that as mountain species move to higher elevations to escape rising global temperatures they will face a consistent loss of territory — as well as an increase in resource competition — that all but ensures their eventual extinction.
While this risk exists in pyramid-shaped ranges, many species in other range types might in fact benefit from seeking higher altitudes if they move to an elevation with more land area than the one they left, Elsen said. The researchers’ results could be used to more precisely identify those elevation zones where species will encounter territory losses and potentially become more threatened as they move upward, he said. The limited resources that exist for conservation could then be targeted to those species.
“This work should completely change the way we see mountains,” Elsen said. “No one has looked at the shapes of mountain ranges across the entire globe, and I don’t think anyone would expect that only 30 percent of the ranges in the world have this pyramid shape that we have assumed is the dominant shape of mountains.
“That has been the prevailing image of mountains in the public perception and the scientific perception, and it’s really had a big influence on how scientists think mountain species will respond to climate change,” he said.
This slideshow requires JavaScript.
The researchers are the first to measure available area by elevation — known as the hypsographic curve — at the scale at which animals actually live, said co-author Morgan Tingley, a University of Connecticut assistant professor of ecology and evolutionary biology and a past postdoctoral research associate in the Program in Science, Technology and Environmental Policy in Princeton’s Woodrow Wilson School of Public and International Affairs.
“People have explored the global pattern wherein you take all the surface area on the Earth and look at availability versus elevation. If you do that, then you do get a nice pyramidal pattern for all mountain ranges because there are so many low-elevation non-mountainous parts of the world,” Tingley said.
“But that’s not a relevant scale for species or conservation. There is no globally distributed mountain species,” he said. “At the spatial scales at which species live, the majority of mountain regions are not pyramids.”
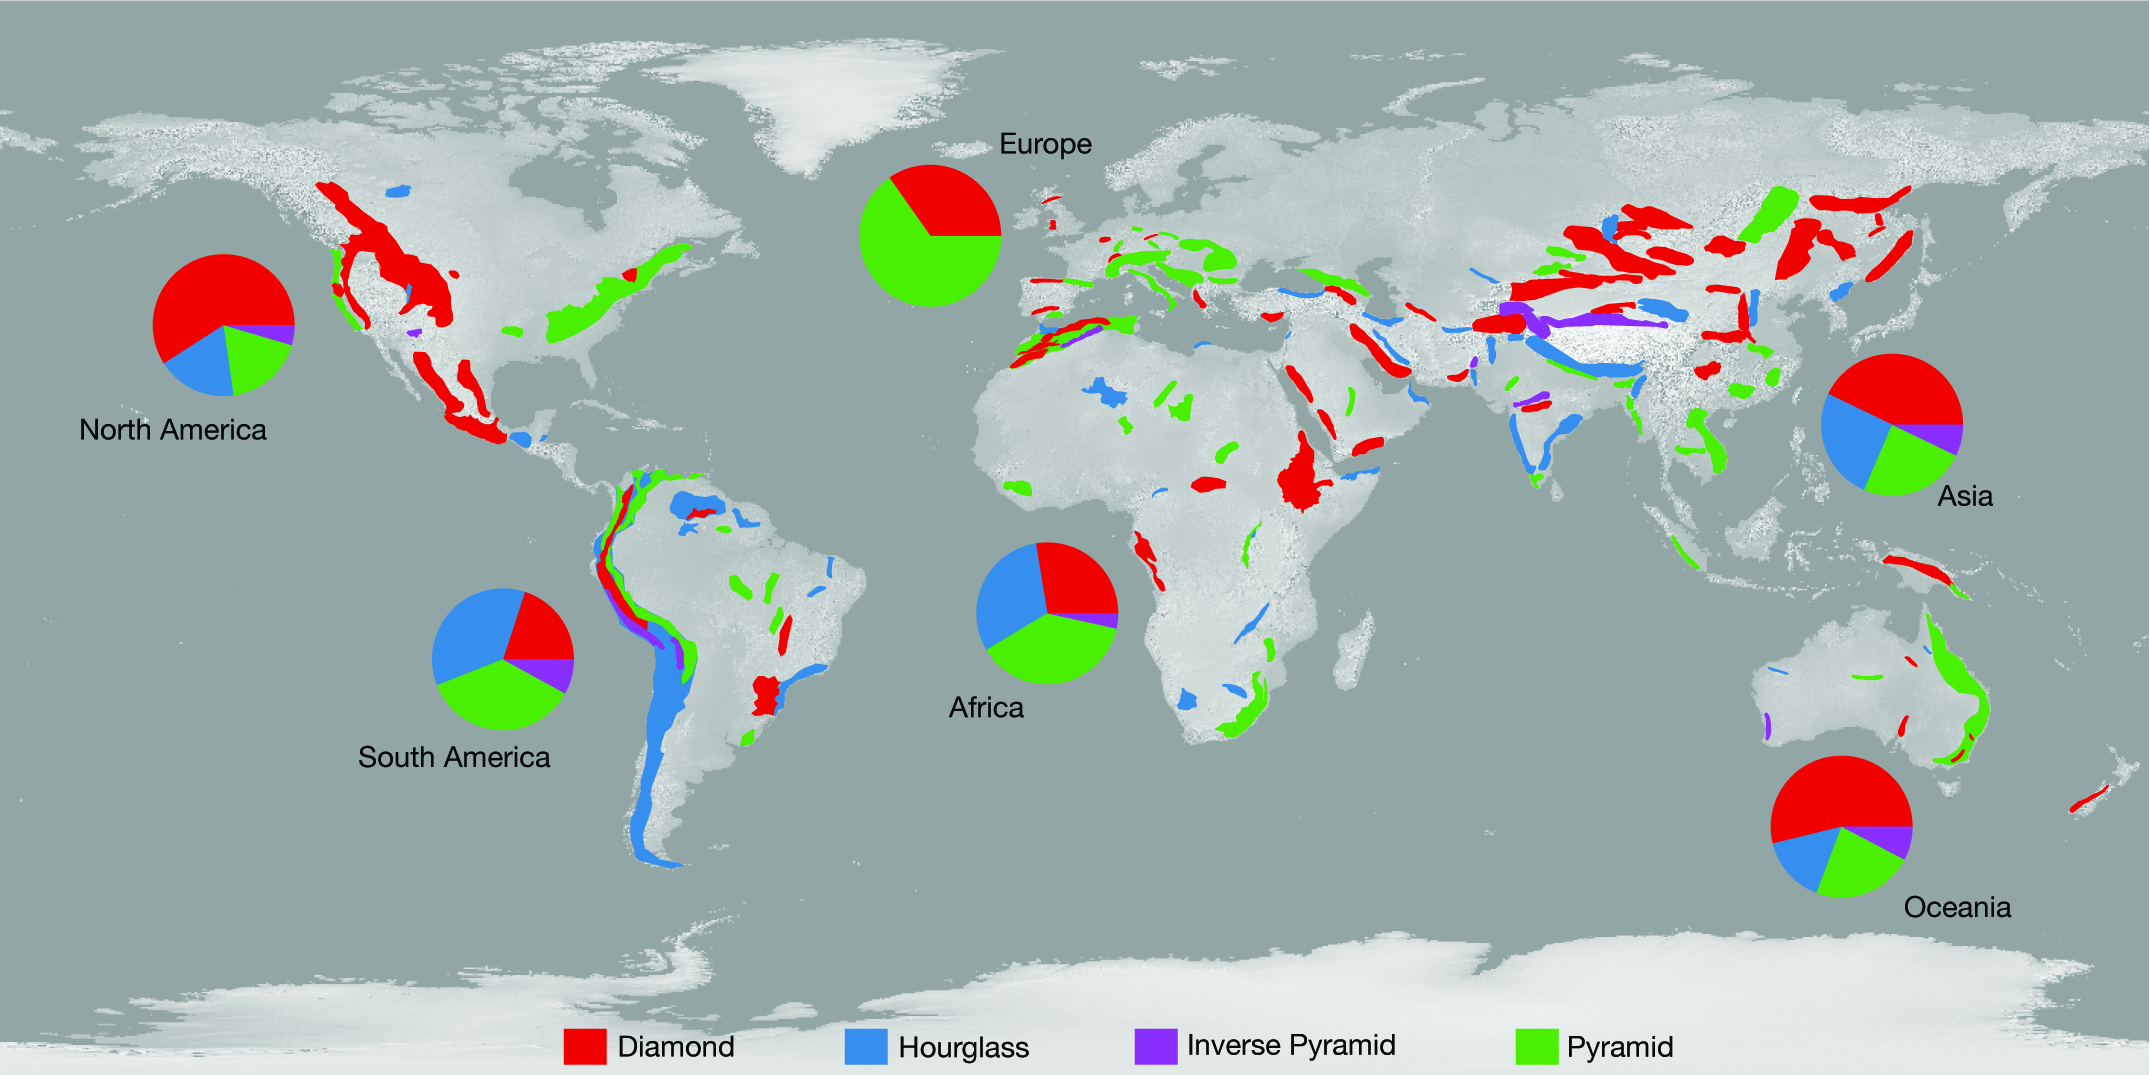
The researchers examined ranges on every continent except Antarctica and found that the pyramid form in which land-area uniformly decreases as elevation increases only applies to roughly one-third of the world’s mountain ranges. A majority, or 39 percent, of the ranges they studied are diamond-shaped (red), whereas pyramid-shaped mountains (green) constitute only 32 percent. The hourglass shape (blue) characterizes 23 percent of ranges, and only 6 percent of ranges take the form of an inverse pyramid (purple).(Image by Paul Elsen, Princeton University Department of Ecology and Evolutionary Biology, and Morgan Tingley, University of Connecticut)
Elsen and Tingley examined ranges on every continent except Antarctica spanning altitudes from zero to more than 8,500 meters (27,887 feet), which is the approximate maximum height of the Himalayas. A majority of the ranges they studied (39 percent) such as the Rocky Mountains are diamond-shaped, meaning that land-area increases from the bottom until the mid-elevation range before contracting quickly.
Hourglass-shaped mountain ranges such as the Himalayas make up 23 percent of ranges. Land area in these types rises slightly then decreases at mid-elevations before increasing sharply at higher elevations.
The nearby Kunlun Mountains of China are representative of the 6 percent of ranges worldwide that take the form of inverse pyramids, which gradually expand in area as elevation increases before, like the hourglass ranges, suddenly widening toward their peaks.
A mainstay of the human mind, pyramid-shaped mountains such as the Alps constitute only 32 percent of the mountain ranges that Elsen and Tingley studied. These mountains have sides that rise sharply and consistently decrease in area the higher they go.
On the other hand, the other range shapes are formed by a series of slopes that rise to open, wide plateaus situated at the base of yet more slopes, Elsen said. These mountains are akin to scaling a giant table where a leg represents a steep, limited-area climb that leads to a high-altitude expanse, he said.
“We expected some interesting exceptions to the pyramid shape – it turned out that pyramids are by far the exception. It’s something that twists your mind around,” Elsen said. “I really encourage people trying to grasp this for the first time to take less of a two-dimensional perspective of looking from the side and picture the range from above — a mountain range is a very three-dimensional system.”
The researchers point out that animals that could benefit from an increase in elevation may still face other threats — habitat loss, food availability and exposure to existing animals and diseases, for instance. Even the range shapes themselves provide unique areas of concern — hourglass-shaped ranges such as the Himalayas, for instance, present a “bottleneck” at mid-elevation that could become overwhelmed with species moving upslope from more expansive lower elevations.
“Not every elevation holds equal value for conservation,” Tingley said. Our research suggests that some gradients, and some portions of gradients, will be more important than others. Protecting land within an elevational bottleneck, for example, will be critical. That is where species will be greatly pressured, and often long before they reach the mountaintop.”
Paul R. Elsen and Morgan W. Tingley. 2015. Global mountain topography and the fate of montane species under climate change. Nature Climate Change. Article published online May 18, 2015. DOI: 10.1038/nclimate2656.
The work was supported by Princeton University, the National Science Foundation Graduate Research Fellowship Program (grant no. DGE-1148900), and the D.H. Smith Conservation Research Fellowship administered by the Society for Conservation Biology and financially supported by the Cedar Tree Foundation.
Sonya Legg, a senior research oceanographer in the Program in Atmospheric and Oceanic Sciences at Princeton University, and colleagues from collaborating institutions created the first “cradle to grave” model of the world’s most powerful internal ocean waves.
Beyond the pounding surf loved by novelists and beachgoers alike, the ocean contains rolling internal waves beneath the surface that displace massive amounts of water and push heat and vital nutrients up from the deep ocean.
Internal waves have long been recognized as essential components of the ocean’s nutrient cycle, and key to how oceans will store and distribute additional heat brought on by global warming. Yet, scientists have not until now had a thorough understanding of how internal waves start, move and dissipate.
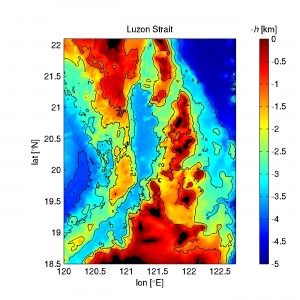
Researchers from the Office of Naval Research’s multi-institutional Internal Waves In Straits Experiment (IWISE) have published in the journal Nature the first “cradle-to-grave” model of the world’s most powerful internal waves. Caused by the tide, the waves move through the Luzon Strait between southern Taiwan and the Philippine island of Luzon that connects the Pacific Ocean to the South China Sea.
The complexity of the Luzon Strait’s two-ridge system was not previously known. The Princeton researchers’ simulations showed that the two ridges of the Luzon Strait greatly amplify the size and energy of the wave, well beyond the sum of what the two ridges would generate separately. The simulation above of the tide moving over the second, or western, ridge shows that the tidally-driven flow reaches a high velocity (top) as it moves down the slope (left to right), creating a large wave in density (black lines) with concentrated turbulent energy dissipation (bottom). As the tide moves back over the ridge, the turbulence is swept away. For both the velocity and energy dissipation panels, the color scale indicates the greatest velocity or energy (red) to the least amount (blue). (Image by Maarten Buijsman, University of Southern Mississippi)
Combining computer models constructed largely by Princeton University researchers with on-ship observations, the researchers determined the movement and energy of the waves from their origin on a double-ridge between Taiwan and the Philippines to when they fade off the coast of China. Known to provide nutrients for whales and pose a hazard to shipping, the Luzon Strait internal waves move west at speeds as fast as 3 meters (18 feet) per second and can be as much as 500 meters (1,640 feet) from trough to crest, the researchers found.
The Luzon Strait internal waves provide an ideal archetype for understanding internal waves, explained co-author Sonya Legg, a Princeton senior research oceanographer in the Program in Atmospheric and Oceanic Sciences and a lecturer in geosciences. The distance from the Luzon Strait to China is relatively short — compared to perhaps the Hawaiian internal wave that crosses the Pacific to Oregon — and the South China Sea is relatively free of obstructions such as islands, crosscurrents and eddies, Legg said. Not only did these factors make the waves much more manageable to model and study in the field, but also resulted in a clearer understanding of wave dynamics that can be used to understand internal waves elsewhere in the ocean, she said.
Researchers from the Office of Naval Research’s multi-institutional Internal Waves In Straits Experiment (IWISE) — including from Princeton University — have published the first “cradle-to-grave” model of internal waves, which are subsurface ocean displacements recognized as essential to the distribution of nutrients and heat. The researchers modeled the internal waves that move through the Luzon Strait between southern Taiwan and the Philippine island of Luzon. Part of the Princeton researchers’ role was to simulate when and where the Luzon Strait’s internal waves are strongest as the tide moves westward from the Pacific Ocean into the South China Sea over a unique double-ridge formation in the strait. The above image shows the two underwater ridges — indicated in green, orange and red — between Taiwan (top) and island of Luzon (bottom). The color scale indicates elevation from lowest (blue) to highest (red). (Image by Maarten Buijsman, University of Southern Mississippi)
“We know there are these waves in other parts of the ocean, but they’re hard to look at because there are other things in the way,” Legg said. “The Luzon Strait waves are in a mini-basin, so instead of the whole Pacific to focus on, we had this small sea — it’s much more manageable. It’s a place you can think of as a laboratory in the ocean that’s much simpler than other parts of the ocean.”
Legg and co-author Maarten Buijsman, who worked on the project while a postdoctoral researcher at Princeton and is now an assistant professor of physical oceanography at the University of Southern Mississippi, created computer simulations of the Luzon Strait waves that the researchers in the South China Sea used to determine the best locations to gather data.
For instance, Legg and Buijsman used their models to pinpoint where and when the waves begin with the most energy as the ocean tide crosses westward over the strait’s two underwater ridges. Notably, their models showed that the two ridges greatly amplify the size and energy of the wave, well beyond the sum of what the two ridges would generate separately. The complexity of a two-ridge system was not previously known, Legg said.
The energy coming off the strait’s two ridges steepens as it moves toward China, evolving from a rolling wavelength to a steep “saw-tooth” pattern, Legg said. These are the kind of data the researchers sought to gather — where the energy behind internal waves goes and how it changes on its way. How an internal wave’s energy is dissipated determines the amount of heat and nutrients that are transferred from the cold depths of the lower ocean to the warm surface waters, or vice versa.
Models used to project conditions on an Earth warmed by climate change especially need to consider how the ocean will move excess heat around, Legg said. Heat that stays at the surface will ultimately result in greater sea-level rise as warmer water expands more readily as it heats up. The cold water of the deep, however, expands less for the same input of heat and has a greater capacity to store warm water. If heat goes to the deep ocean, that could greatly increase how much heat the oceans can absorb, Legg said.
As researchers learn more about internal waves such as those in the Luzon Strait, climate models can be tested against what becomes known about ocean mechanics to more accurately project conditions on a warmer Earth, she said.
“Ultimately, we want to know what effect the transportation and storage of heat has on the ocean. Internal waves are a significant piece in the puzzle in telling us where heat is stored,” Legg said. “We have in the Luzon Strait an oceanic laboratory where we can test our theoretical models and simulations to see them play out on a small scale.”
This work supported by the U.S. Office of Naval Research and the Taiwan National Science Council.
Matthew H. Alford, et al. 2015. The formation and fate of internal waves in the South China Sea. Nature. Article published online in-advance-of-print May 7, 2015. DOI: 10.1038/nature14399
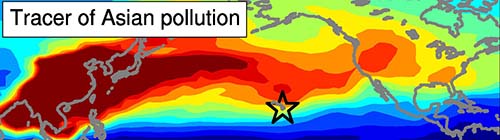
Asian pollution drifts east toward North America in 2010. Hawaii is denoted by the star. (Source: Nature Geoscience)
By Joanne Curcio, Program in Atmospheric and Oceanic Sciences
Air pollution from Asia has been rising for several decades but Hawaii had seemed to escape the ozone pollution that drifts east with the springtime winds. Now a team of researchers has found that shifts in atmospheric circulation explain the trends in Hawaiian ozone pollution.
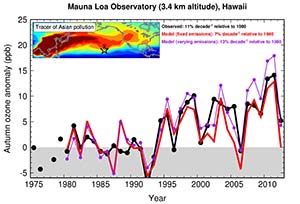
Researchers found that ozone levels measured during autumn at Mauna Loa Observatory in Hawaii (black line) accurately reflect the trend in rising Asian air pollution from 1975 to 2012. The researchers demonstrated that the autumnal rise in ozone could be explained by atmospheric and climatic shifts over periods of decades. Using a chemistry-climate model, the researchers modeled this autumnal variation in ozone using constant (red) and time-varying (purple) emissions of ozone precursors. (Source: Nature Geoscience.)
“The findings indicate that decade-long variability in climate must be taken into account when attributing U.S. surface ozone trends to rising Asian emissions,” Lin said. She conducted the research with Larry Horowitz and Songmiao Fan of GFDL, Samuel Oltmans of the University of Colorado and the NOAA Earth System Research Laboratory in Boulder; and Arlene Fiore of the Lamont-Doherty Earth Observatory at Columbia University.
Although protective at high altitudes, ozone near the Earth’s surface is a greenhouse gas and a health-damaging air pollutant. The longest record of ozone measurements in the U.S. dates back to 1974 in Hawaii. Over the past few decades, emissions of ozone precursors in Asia has tripled, yet the 40-year Hawaiian record revealed little change in ozone levels during spring, but a surprising rise in autumn.
Through their research, Lin and her colleagues solved the puzzle. “We found that changing wind patterns ‘hide’ the increase in Asian pollution reaching Hawaii in the spring, but amplify the change in the autumn,” Lin said.
Using chemistry-climate models and observations, Lin and her colleagues uncovered the different mechanisms driving spring versus autumn changes in atmospheric circulation patterns. The findings indicate that the flow of ozone-rich air from Eurasia towards Hawaii during spring weakened in the 2000s as a result of La-Niña-like decadal cooling in the equatorial Pacific Ocean. The stronger transport of Asian pollution to Hawaii during autumn since the mid-1990s corresponds to a positive pattern of atmospheric circulation variability known as the Pacific-North American pattern.
“This study not only solves the mystery of Hawaiian ozone changes since 1974, but it also has broad implications for interpreting trends in surface ozone levels globally,” Lin said. “Characterizing shifts in atmospheric circulation is of paramount importance for understanding the response of surface ozone levels to a changing climate and evolving global emissions of ozone precursors,” she said.
The work was supported by NOAA’s Cooperative Institute for Climate Science at Princeton University. Ozone measurements were obtained at Mauna Loa Observatory, operated by NOAA’s Earth System Research Laboratory.
Meiyun Lin, Larry W. Horowitz, Samuel J. Oltmans, Arlene M. Fiore, Songmiao Fan. Tropospheric ozone trends at Mauna Loa Observatory tied to decadal climate variability. Nature Geoscience, Published Online: 26 January, 2014, http://dx.doi.org/10.1038/ngeo2066.
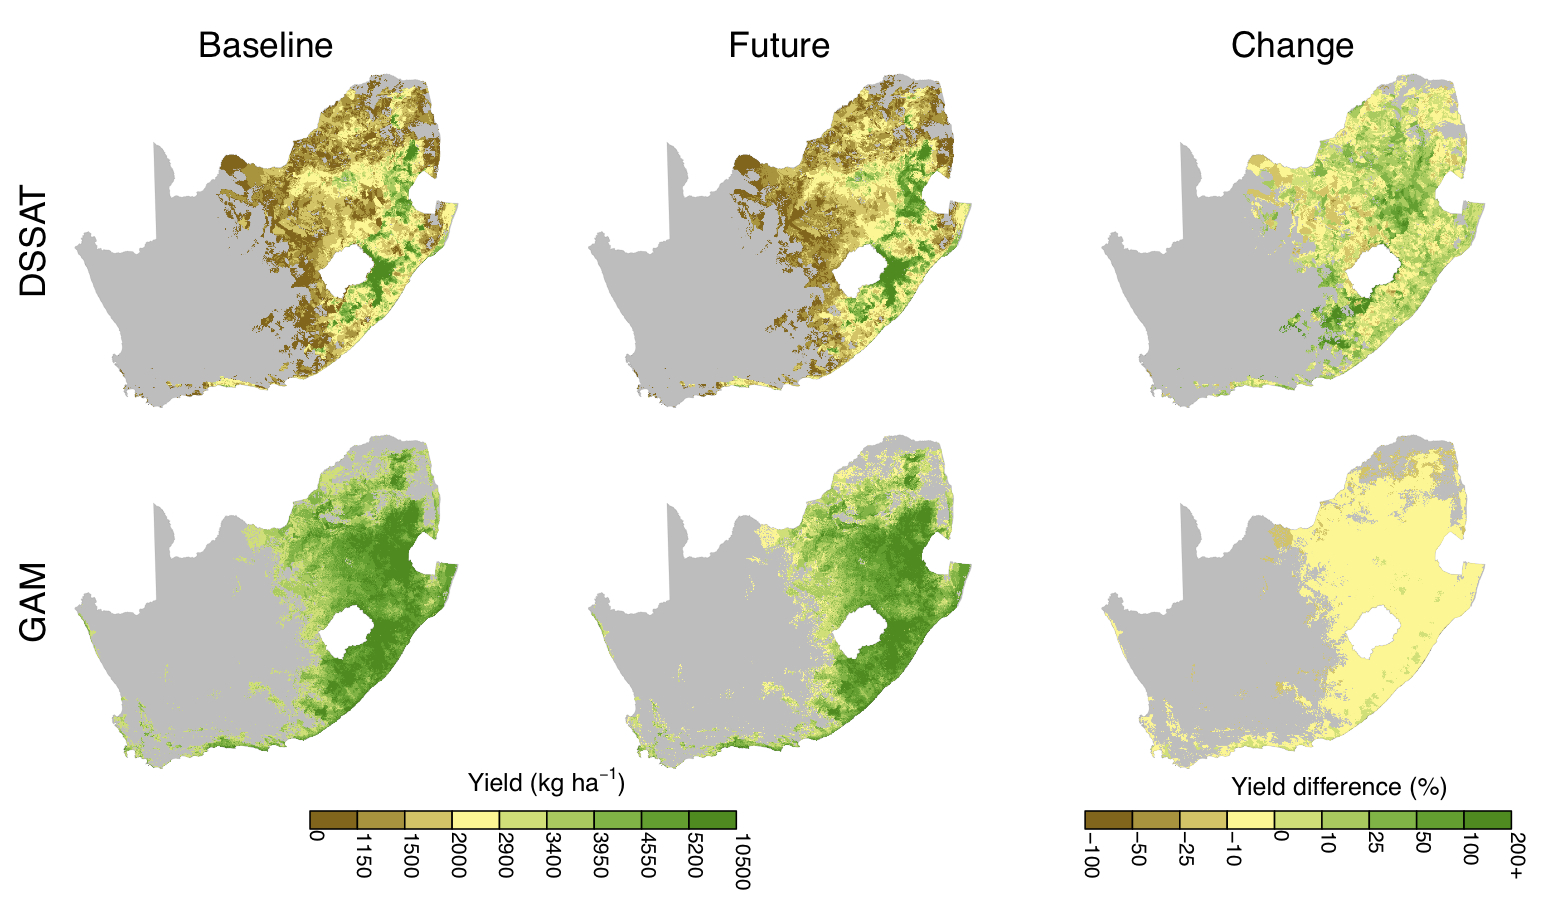
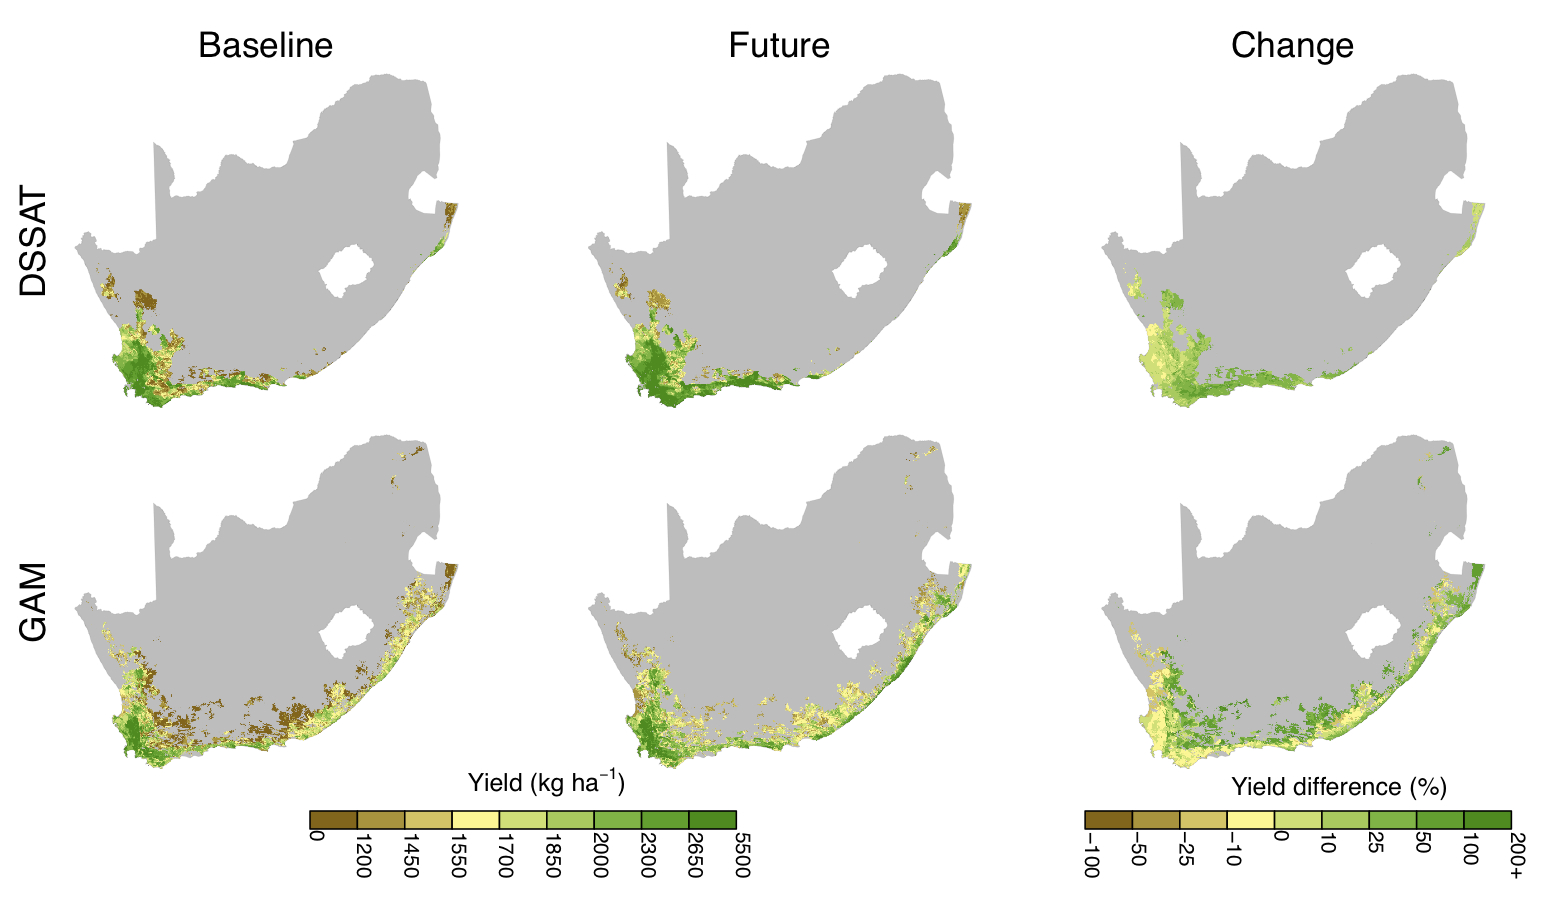
Mechanistic (top row) and empirical (bottom row) simulations compared recent, or “baseline,” maize production in South Africa (1979-99) to projected future production under climate change (2046-65). While both models showed a reduction in output, the third column shows that the empirical model estimated a widespread yield loss of around 10 percent (in yellow), while the mechanistic model showed several areas of increased production (in green). (Image by Lyndon Estes)For wheat, the mechanistic model (top row) projected greater wheat yields, while the empirical model (bottom row) suggested that wheat-growing areas would expand by almost 50 percent. (Image by Lyndon Estes)
By Morgan Kelly, Office of Communications
The damage scientists expect climate change to do to crop yields can differ greatly depending on which type of model was used to make those projections, according to research based at Princeton University. The problem is that the most dire scenarios can loom large in the minds of the public and policymakers, yet neither audience is usually aware of how the model itself influenced the outcome, the researchers said.
The report in the journal Global Change Biology is one of the first to compare the agricultural projections generated by empirical models — which rely largely on field observations — to those by mechanistic models, which draw on an understanding of how crop growth and development are affected by the environment. Building on similar studies from ecology, the researchers found yet more evidence that empirical models may show greater losses as a result of climate change, while mechanistic models may be overly optimistic.
The researchers ran an empirical and a mechanistic model to see how maize and wheat crops in South Africa — the world’s ninth largest maize producer, and sub-Saharan Africa’s second largest source of wheat — would fare under climate change in the years 2046 to 2065. Under the hotter, wetter conditions projected by the climate scenarios they used, the empirical model estimated that maize production could drop by 3.6 percent, while wheat output could increase by 6.2 percent. Meanwhile, the mechanistic model calculated that maize and wheat yields might go up by 6.5 and 15.2 percent, respectively.
In addition, the empirical model estimated that suitable land for growing wheat would drop by 10 percent, while the mechanistic model found that it would expand by 9 percent. The empirical model projected a 48 percent expansion in wheat-growing areas, but the mechanistic reported only 20 percent growth. In regions where the two models overlapped, the empirical model showed declining yields while the mechanistic model showed increases. These wheat models were less accurate, but still indicative of the vastly different estimates empirical and mechanistic can produce, the researchers wrote.
Disparities such as these aren’t just a concern for climate-change researchers, said first author Lyndon Estes, an associate research scholar in the Program in Science, Technology and Environmental Policy in Princeton’s Woodrow Wilson School of Public and International Affairs. Impact projections are crucial as people and governments work to understand and address climate change, but it also is important that people understand how they are generated and the biases inherent in them, Estes said. The researchers cite previous studies that suggest climate change will reduce South African maize and wheat yields by 28 to 30 percent — according to empirical studies. Mechanistic models project a more modest 10 to 19 percent loss. What’s a farmer or government minister to believe?
“A yield projection based only on empirical models is likely to show larger yield losses than one made only with mechanistic models. Neither should be considered more right or wrong, but people should be aware of these differences,” Estes said. “People who are interested in climate-change science should be aware of all the sources of uncertainty inherent in projections, and should be aware that scenarios based on a single model — or single class of models — are not accounting for one of the major sources of uncertainty.”
The researchers’ work relates to a broader effort in recent years to examine the biases introduced into climate estimates by the models and data scientists use, Estes said. For instance, a paper posted Aug. 7 by Global Change Biology — and includes second author and 2011 Princeton graduate Ryan Huynh — challenges predictions that higher global temperatures will result in the widespread extinction of cold-blooded forest creatures, particularly lizards. These researchers say that a finer temperature scale than existing projections use suggests that many cold-blooded species would indeed thrive on a hotter Earth.
Scientists are aware of the differences between empirical and mechanistic models, said Estes, who was prompted by a similar comparison that showed an empirical-mechanistic divergence in tree-growth models. Yet, only one empirical-to-mechanistic comparison (of which Estes also was first author) has been published in relation to agriculture — and it didn’t even examine the impact of climate change.
The solution would be to use both model classes so that researchers could identify each class’s biases and correct for it, Estes said. Each model has different strengths and weaknesses that can be complementary when combined.
Simply put, empirical models are built by finding the relationship between observed crop yields and historical environmental conditions, while mechanistic models are built on the physiological understanding of how the plant grows and reproduces in response to a range of conditions. Empirical models, which are simpler and require fewer inputs, are a staple in studying the possible effects of climate change on ecological systems, where the data and knowledge about most species is largely unavailable. Mechanistic models are more common in studying agriculture because there is a much greater wealth of data and knowledge that has accumulated over several thousand years of agricultural development, Estes said.
“These two model classes characterize different portions of the environmental space, or niche, that crops and other species occupy,” Estes said. “Using them together gives us a better sense of the range of uncertainty in the projections and where the errors and limitations are in the data and models. Because the two model classes have such different structures and assumptions, they also can improve our confidence in scenarios where their findings agree.”
Estes, Lyndon D., Hein Beukes, Bethany A. Bradley, Stephanie R. Debats, Michael Oppenheimer, Alex C. Ruane, Roland Schulze and Mark Tadross. 2013. Projected climate impacts to South African maize and wheat production in 2055: A comparison of empirical and mechanistic modeling approaches. Global Change Biology. Accepted, unedited article first published online: July 17, 2013. DOI: 10.1111/gcb.12325
Periodic floods are a normal occurrence in wetlands. To find out how these floods impact niches of different plant species in wetlands, Princeton researchers studied plant species in Everglades National Park (ENP) in Florida. They found that the sizes of the clusters of each species follow a power law probability distribution and that such clusters have well-defined fractal characteristics. They modeled the effect that periodic flooding and neighboring vegetation have on plant clusters. They found that climate and land management have a predictable impact on the type of vegetation and its spatial organization in wetlands. The findings are highly relevant for the management of wetland ecosystems.
R Foti, M Del Jesus, A Rinaldo, and I Rodriguez-Iturbe. Hydroperiod regime controls the organization of plant species in wetlands. PNAS, November 13, 2012


 By Morgan Kelly, Office of Communications
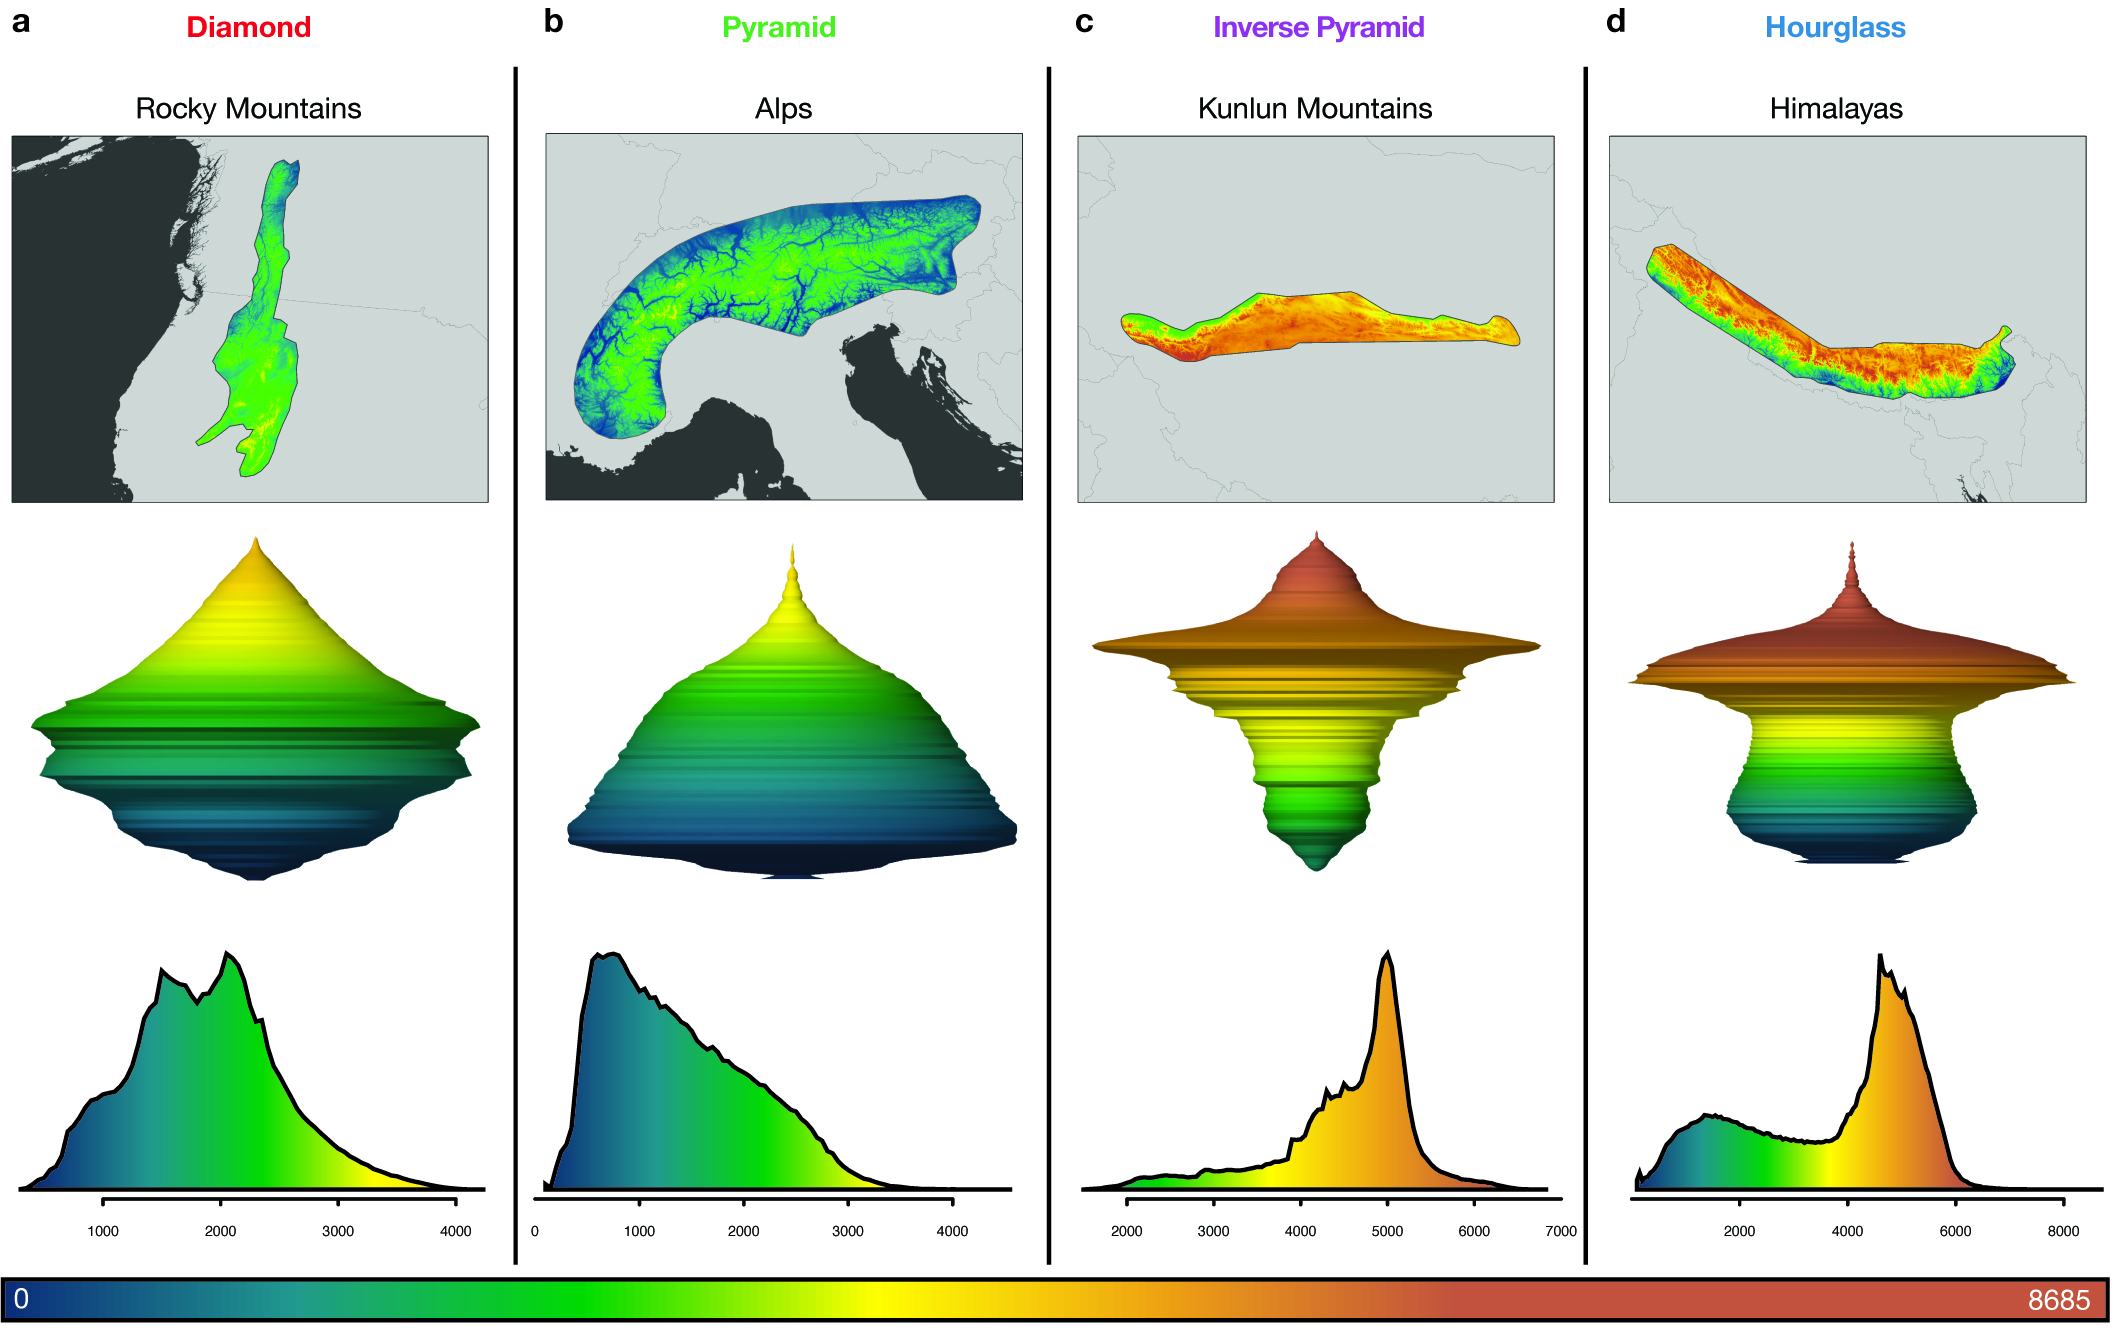

You must be logged in to post a comment.