
Group #7, Team Colonial Club
David Lackey (dlackey), John O’Neill (jconeill), and Horia Radoi (hradoi)
Mission Statement
We are evaluating a system that makes users aware of bad posture during extended hours of sitting.
Many people are bound to sedentary lifestyles because of academics, desk jobs, etc. If people have bad posture during the hours that they are seated, then it can lead to back problems later in life, such as degenerative disc disease. We want our system to quickly alert people in the event that they have bad back posture so that they can avoid its associated negative long term effects.
From our first evaluation of our low-fidelity prototype, we hope to gain insight into what it will take to make a wearable back posture sensor. We also want to learn how to correctly display relevant back posture information / statistics to the user. Figuring out how to alert the user is important as well.
Concise Mission Statement
It is our mission to help users recognize when they have bad posture while sitting so that they can avoid long term back problems.
Team Roles
David – Drafted mission statement.
John – Initiated construction / task evaluations.
Horia – Formatting.
Description of Prototype
Our prototype consists of two components: the wearable device and the desktop interface. The first is intended to replicate how the user engages with the wearable component, and, as a prototype, demonstrate how vibrations are delivered to points on the users back where they are deviating from their desired posture. The second component serves two purposes: 1. to demonstrate how the user sets their desired / default posture, and 2. to display to the user how the specific areas of their back deviate from their desired position over time.
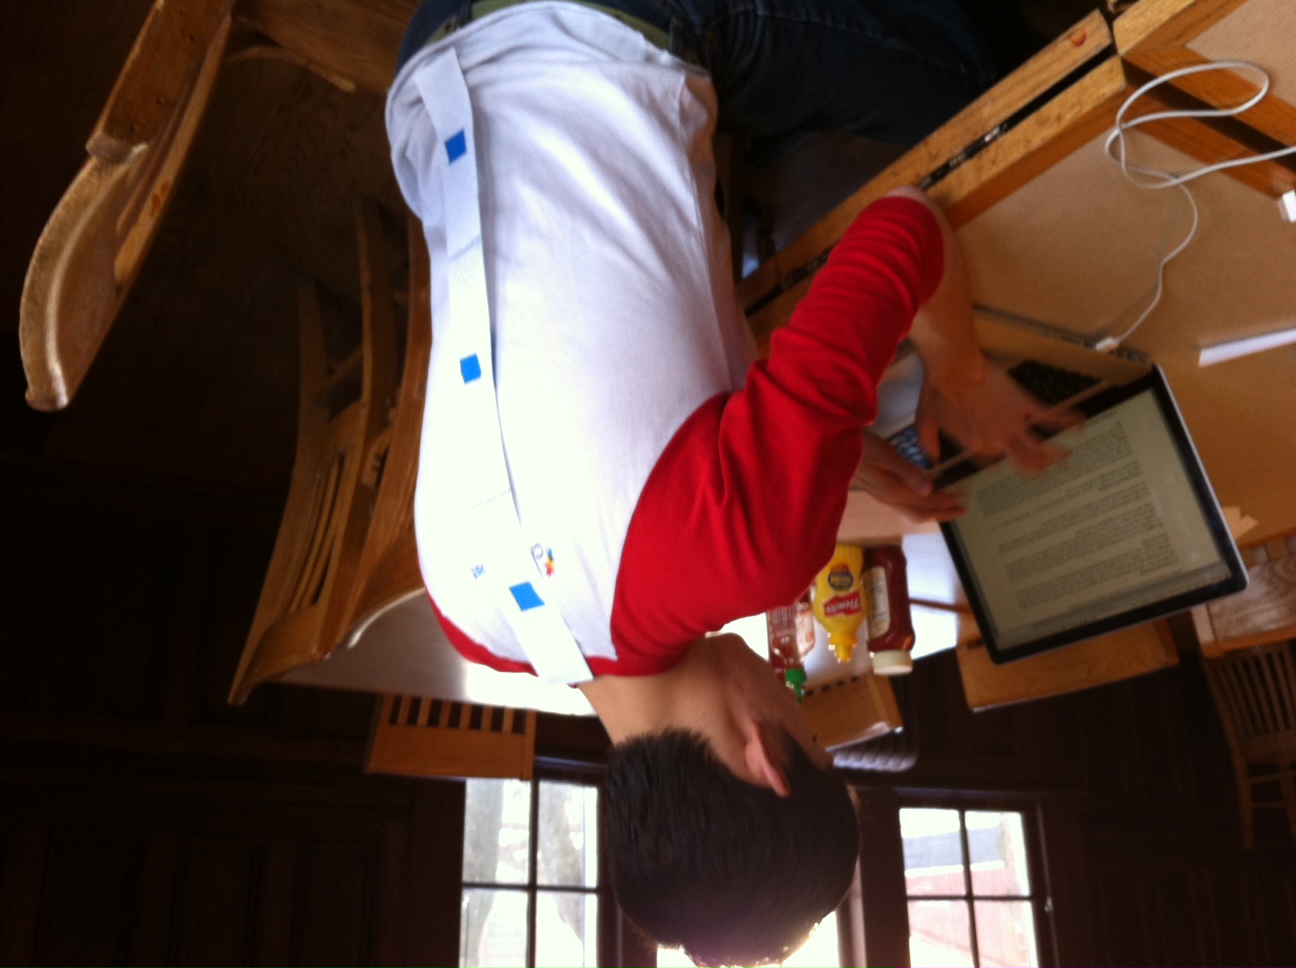
User is working at table with device attached. Note that there are there sensors, each one designating a specific portion of the spine.
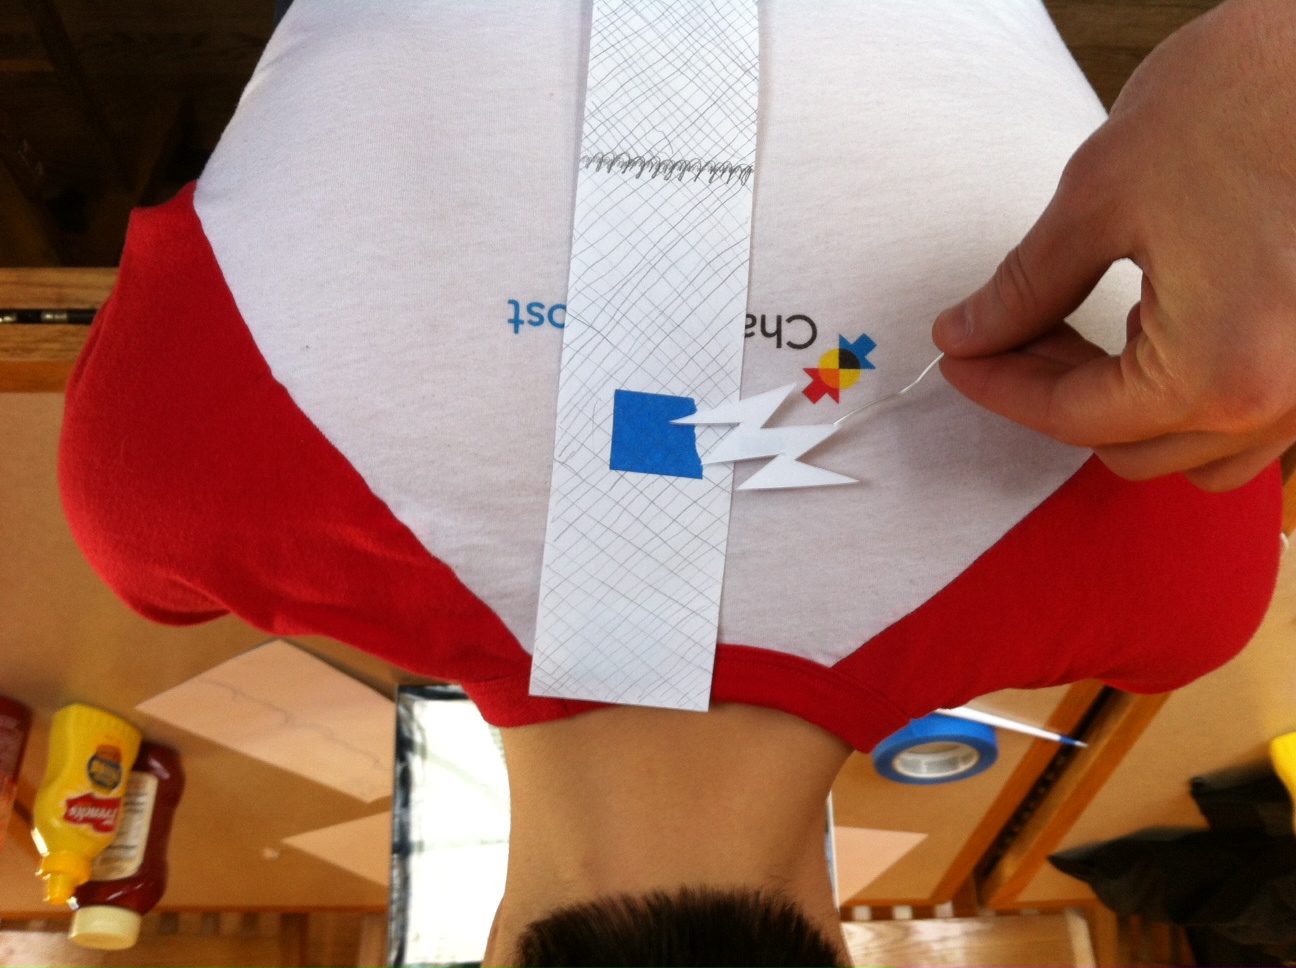
Here we demonstrate a vibration given by the device. We represent the location of vibrating motors with the placement of blue tape.
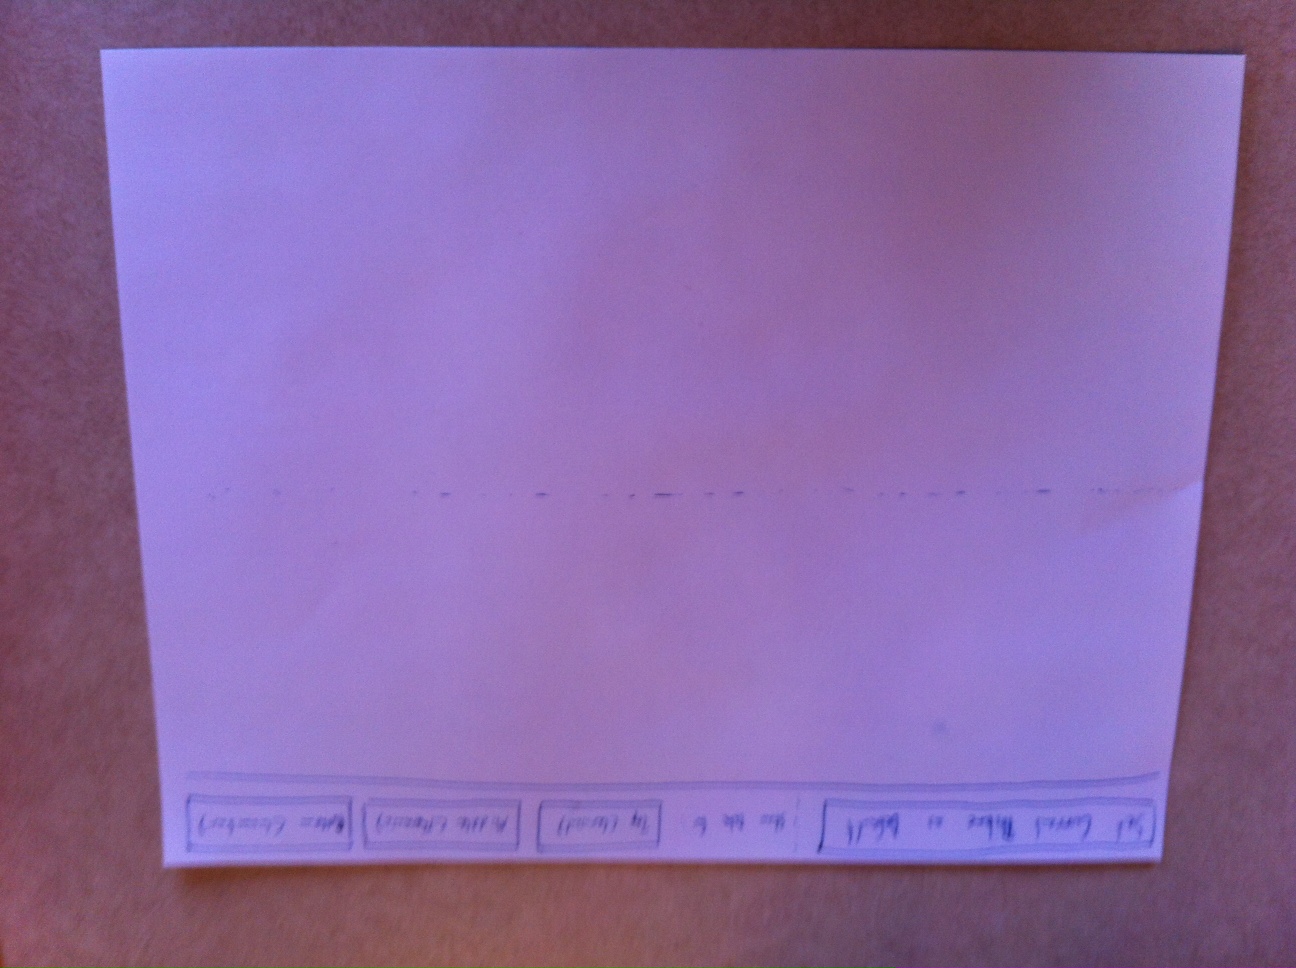
Base interface before readings have been taken / default has been set.
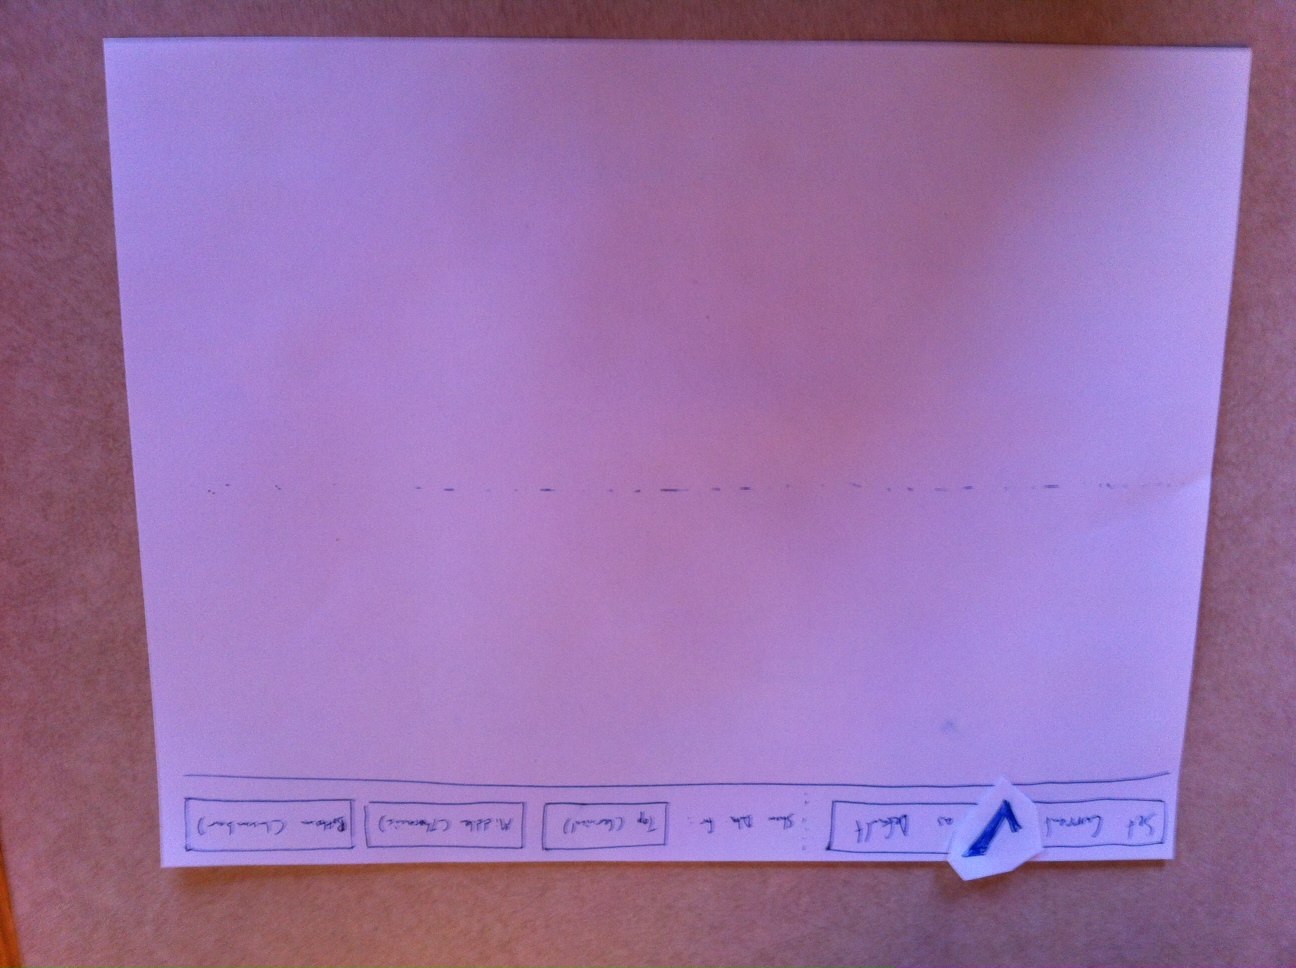
Once user sets default / desired posture, a confirmation check is placed on the screen for validation.
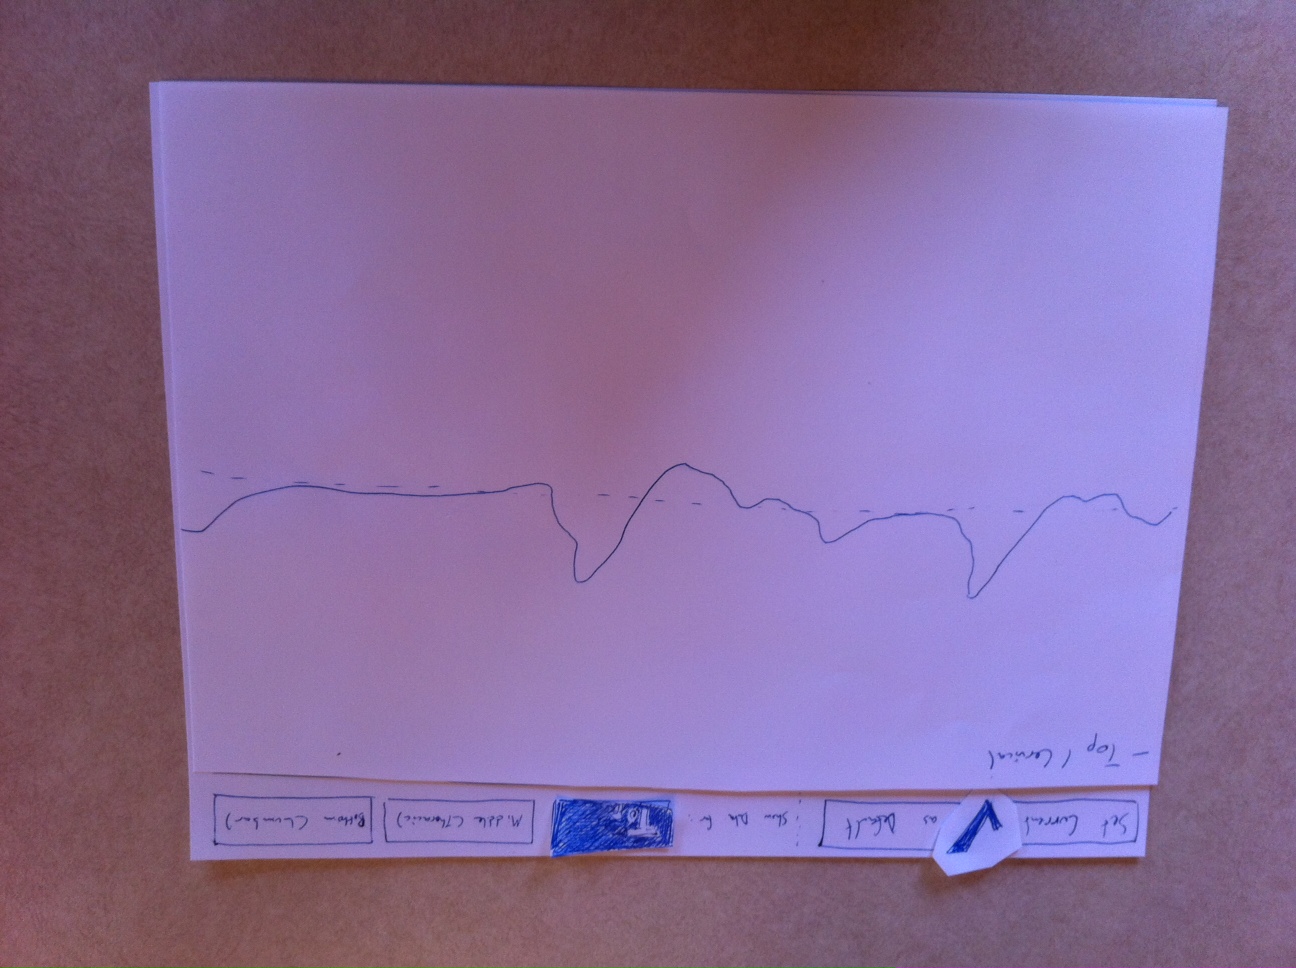
The user chooses to display the information provided by the top set of sensors.

The user chooses to also display the data received from the middle set of sensors. This data is laid over the other set of data that has previously been selected.
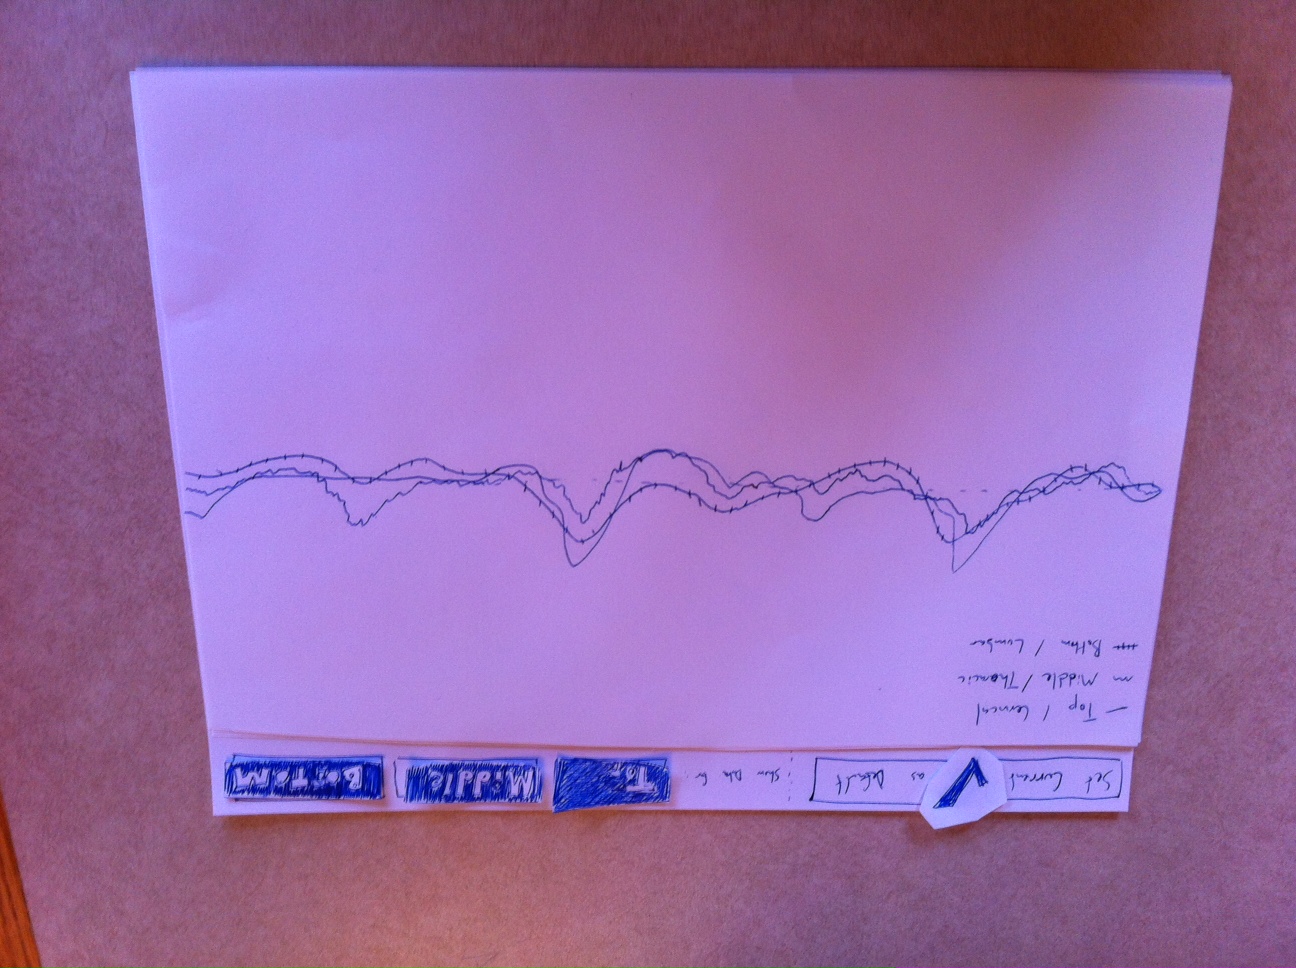
The user has selected to show all three sets of data.
Task Descriptions
Task #1: Set up a desired back position (medium)
For this task, the user is placing the device on their back and is designating their desired back position. Doing so enables the user to use the remaining features, and allows the user to customize the “base” posture that they wish to abide by.
[kaltura-widget uiconfid=”1727958″ entryid=”0_q2ik6xwp” width=”400″ height=”360″ addpermission=”” editpermission=”” /]
Task #2: Alert user if back position / posture deviates too far from desired posture (easy)
For this task, the user is alerted if they deviate from the posture they originally wished to maintain. This helps the user become conscious of – and thus, adjust – any areas of their back that may be receiving excessive stress. The user is notified by the vibration of a motor near the area(s) of concern.
[kaltura-widget uiconfid=”1727958″ entryid=”0_s475xnr3″ width=”400″ height=”360″ addpermission=”” editpermission=”” /]
Task #3: Monitor how their posture changes. (hard)
[kaltura-widget uiconfid=”1727958″ entryid=”0_1of32m3f” width=”400″ height=”360″ addpermission=”” editpermission=”” /]
Prototype Discussion
1. We created both components using paper and tape, using pen to designated different forms of information – data over time, buttons, and our mesh resistors.
2. We agreed that a mock paper wearable device, as well as as a mock paper computer interface, were an appropriate step before creating a sensor-rich, coded version.
3. One thing that was difficult was determined how we wished to represent the deviance data over time. We decided that the best was to have a baseline: then, as a sensor bent one way, it traveled above this baseline – conversely, as it bent the other way, the plot line traveled below.
4. One thing that worked well was using different versions of the graph on different sheets of paper. This allowed us to easily show how user actions (specifically, selected buttons) would effect changes in the graph.