Dolphin-disease outbreak shows how to account for the unknown when tracking epidemics (Journal of the Royal Society Interface)

By Morgan Kelly, Office of Communications

Common bottlenose dolphin. Image credit: Allison Henry, NOAA.

Stopping the outbreak of a disease hinges on a wealth of data such as what makes a suitable host and how a pathogen spreads. But gathering these data can be difficult for diseases in remote areas of the world, or for epidemics involving wild animals.

A new study led by Princeton University researchers and published in the Journal of the Royal Society Interface explores an approach to studying epidemics for which details are difficult to obtain. The researchers analyzed the 2013 outbreak of dolphin morbillivirus — a potentially fatal pathogen from the same family as the human measles virus — that resulted in more than 1,600 bottlenose dolphins becoming stranded along the Atlantic coast of the United States by 2015. Because scientists were able to observe dolphins only after they washed up on shore, little is known about how the disease transmits and persists in the wild.

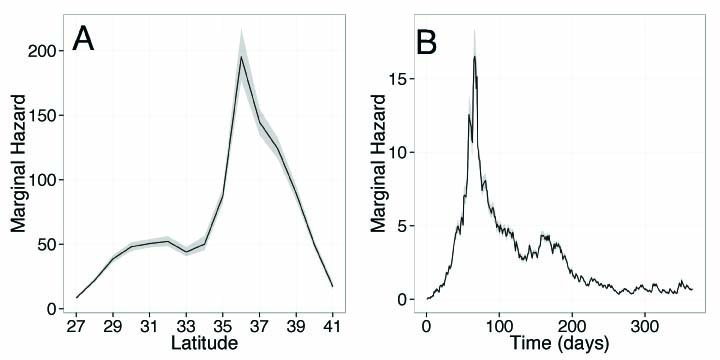
The researchers used a Poisson process — a statistical tool used to model the random nature of disease transmission — to determine from sparse data how dolphin morbillivirus can spread. They found that individual bottlenose dolphins may be infectious for up to a month and can spread the disease over hundreds of miles, particularly during seasonal migrations. In 2013, the height of disease transmission occurred toward the end of summer around an area offshore of Virginia Beach, Virginia, where multiple migratory dolphin groups are thought to cross paths.

In the interview below, first author Sinead Morris, a graduate student in ecology and evolutionary biology, explains what the researchers learned about the dolphin morbillivirus outbreak, and how the Poisson process can help scientists understand human epidemics. Morris is in the research group of co-author Bryan Grenfell, Princeton’s Kathryn Briger and Sarah Fenton Professor of Ecology and Evolutionary Biology and Public Affairs.

Q: How does the Poisson process track indirectly observed epidemics and what specific challenges does it overcome?

A: One of the main challenges in modeling indirectly observed epidemics is a lack of data. In our case, we had information on all infected dolphins that had been found stranded on shore, but had no data on the number of individuals that became infected but did not strand. The strength of the Poisson process is that its simple framework means it can be used to extract important information about the how the disease is spreading across space and time, despite having such incomplete data. Essentially the way the process works is that it keeps track of where and when individual dolphins stranded, and then at each new point in the epidemic it uses the history of what has happened before to project what will happen in the future. For example, an infected individual is more likely to transmit the disease onwards to other individuals in close spatial proximity than to those far away. So, by keeping track of all these infections the model can identify where and when the largest risk of new infections will be.

Q: Why was this 2013-15 outbreak of dolphin morbillivirus selected for study, and what key insights does this work provide?

A: The recent outbreak of dolphin morbillivirus spread rapidly along the northwestern Atlantic coast from New York to Florida, causing substantial mortality among coastal bottlenose dolphin populations. Despite the clear detrimental impact that this disease can have, however, it is still poorly understood. Therefore, our aim in modeling the epidemic was to gain much needed information about how the virus spreads. We found that a dolphin may be infectious for up to 24 days and can travel substantial distances (up to 220 kilometers, or 137 miles) within this time. This is important because such long-range movements — for example, during periods of seasonal migration — are likely to create many transmission opportunities from infected to uninfected individuals, and may have thus facilitated the rapid spread of the virus down the Atlantic coast.

Q: Can this model be used for human epidemics?

A: The Poisson process framework was originally developed to model the occurrence of earthquakes, and has since been used in a variety of other contexts that also tend to suffer from noisy, indirectly observed data, such as urban crime distribution. To model dolphin morbillivirus, we adapted the framework to incorporate more biological information, and similar techniques have also been applied to model meningococcal disease in humans, which can cause meningitis and sepsis. Generally, the data characterizing human epidemics are more detailed than the data we had for this project and, as such, models that can incorporate greater complexity are more widely used. However, we hope that our methods will stimulate the greater use of Poisson process models in epidemiological systems that also suffer from indirectly observed data.

Graph of predictions of risk of disease transmission.
A new study led by Princeton University researchers used a Poisson process to analyze sparse data from the 2013 outbreak of morbillivirus among bottlenose dolphins along the United States’ Atlantic coast. This graph shows the model predictions of how the risk of disease transmission (marginal hazard) changes over space (A) and time (B) since the beginning of the epidemic. The peaks indicate that the greatest risk of transmission occurred around day 70 of the epidemic between 36 and 37 degrees north latitude, which is an area that encompasses the offshore waters of Virginia Beach, Virginia. These peaks coincide with a period towards the end of summer when large numbers of dolphins are known to gather around Virginia Beach as their seasonal migratory ranges overlap. (Image courtesy of Sinead Morris, Princeton University)

This research was supported by the RAPIDD program of the Science and Technology Directorate of the Department of Homeland Security; the National Institutes of Health Fogarty International Center; the Bill and Melinda Gates Foundation; and the Marine Mammal Unusual Mortality Event Contingency Fund and John H. Prescott Marine Mammal Rescue Assistance Grant Program operated by the National Oceanic and Atmospheric Administration.

Read the abstract.

Sinead E. Morris, Jonathan L. Zelner, Deborah A. Fauquier, Teresa K. Rowles, Patricia E. Rosel, Frances Gulland and Bryan T. Grenfell. “Partially observed epidemics in wildlife hosts: modeling an outbreak of dolphin morbillivirus in the northwestern Atlantic, June 2013–2014.” Journal of the Royal Society Interface, published Nov. 18 2015. DOI: 10.1098/rsif.2015.0676


Study calculates the speed of ice formation (PNAS)

ice_cube_bannerBy Catherine Zandonella, Office of the Dean for Research

Researchers at Princeton University have for the first time directly calculated the rate at which water crystallizes into ice in a realistic computer model of water molecules. The simulations, which were carried out on supercomputers, provide insight into the mechanism by which water transitions from a liquid to a crystalline solid.

Understanding ice formation adds to our knowledge of how cold temperatures affect both living and non-living systems, including how living cells respond to cold and how ice forms in clouds at high altitudes. A more precise knowledge of the initial steps of freezing could eventually help improve weather forecasts and climate models, as well as inform the development of better materials for seeding clouds to increase rainfall.

The researchers looked at the process by which, as the temperature drops, water molecules begin to cling to each other to form a blob of solid ice within the surrounding liquid. These blobs tend to disappear quickly after their formation. Occasionally, a large enough blob, known as a critical nucleus, emerges and is stable enough to grow rather than to melt. The process of forming such a critical nucleus is known as nucleation.

To study nucleation, the researchers used a computerized model of water that mimics the two atoms of hydrogen and one atom of oxygen found in real water. Through the computer simulations, the researchers calculated the average amount of time it takes for the first critical nucleus to form at a temperature of about 230 degrees Kelvin or minus 43 degrees Celsius, which is representative of conditions in high-altitude clouds.

They found that, for a cubic meter of pure water, the amount of time it will take for a nucleus to form is about one-millionth of a second. The study, conducted by Amir Haji-Akbari, a postdoctoral research associate, and Pablo Debenedetti, a professor of chemical and biological engineering, was published online this week in the journal Proceedings of the National Academy of Sciences.

“The main significance of this work is to show that it is possible to calculate the nucleation rate for relatively accurate models of water,” said Haji-Akbari.

Cubic ice
Cubic ice is made of double-diamond cages, each of which contains 14 water molecules arranged into seven interconnected six-member rings.
Hexagonal ice
Hexagonal ice is made of hexagonal cages, each of which contains 12 water molecules arranged into two six-membered rings that sit on top of each other.

In addition to calculating the nucleation rate, the researchers explored the origin of the two different crystalline shapes that ice can take at ambient pressure. The ice that we encounter in daily life is known as hexagonal ice. A second form, cubic ice, is less stable and can be found in high-altitude clouds. Both ices are made up of hexagonal rings, with an oxygen atom on each vertex, but the relative arrangement of the rings differs in the two structures.

“When water nucleates to form ice there is usually a combination of the cubic and hexagonal forms, but it was not well-understood why this would be the case,” said Haji-Akbari. “We were able to look at how the shapes of ice blobs change during the nucleation process, and one of the main findings of our work is to explain how a less stable form of ice is favored over the more stable hexagonal ice during the initial stages of the nucleation process.” (See figure below.)

Debenedetti added, “What we found in our simulations is that before we go to hexagonal ice we tend to form cubic ice, and that was very satisfying because this has been reported in experiments.” One of the strengths of the study, Debenedetti said, was the innovative method developed by Haji-Akbari to identify cubic and hexagonal forms in the computer simulation.

Computer models come in handy for studies of nucleation because conducting experiments at the precise temperatures and atmospheric conditions when water molecules nucleate is very difficult, said Debenedetti, who is Princeton’s Class of 1950 Professor in Engineering and Applied Science and Dean for Research. But these calculations take huge amounts of computer time.

Haji-Akbari found a way to complete the calculation, whereas previous attempts failed to do so. The technique for modeling ice formation involves looking at computer-simulated blobs of ice, known as crystallites, as they form. Normally the technique involves looking at the crystallites after every step in the simulation, but Haji-Akbari modified the procedure such that longer intervals of time could be examined, enabling the algorithm to converge to a solution and obtain a sequence of crystallites that eventually led to the formation of a critical nucleus.

Model of ice nucleation
Using a computer model to explore how water molecules connect and nucleate into ice crystals, the researchers found that two types of ice compete for dominance during nucleation: cubic ice (blue) which is less stable, and hexagonal ice (red), which is stable and forms the majority of ice on Earth. Nucleation occurs when water molecules come together to form blobs (pictured above), which grow over time (left to right). Eventually hexagonal ice wins out (not shown). The researchers found that adding new cubic features onto an existing crystalline blob gives rise to nuclei that are more spherical, and hence more stable. In contrast, adding hexagonal features tends to give rise to chains of hexagonal cages that make the nucleus less spherical, and hence less stable.

Even with the modifications, the technique took roughly 21 million computer processing unit (CPU) hours to track the behavior of 4,096 virtual water molecules in the model, which is known as TIP4P/Ice and is considered one of the most accurate molecular models of water. The calculations were carried out on several supercomputers, namely the Della and Tiger supercomputers at the Princeton Institute for Computational Science and Engineering; the Stampede supercomputer at the Texas Advanced Computing Center; the Gordon supercomputer at the San Diego Supercomputer Center; and the Blue Gene/Q supercomputer at the Rensselaer Polytechnic Institute.

Debenedetti noted that the rate of ice formation obtained in their calculations is much lower than what had been found by experiment. However, the computer calculations are extremely sensitive, meaning that small changes in certain parameters of the water model have very large effects on the calculated rate. The researchers were able to trace the discrepancy, which is 10 orders of magnitude, to aspects of the water model rather than to their method. As the modeling of water molecules improves, the researchers may be able to refine their calculations of the rate.

The research was funded by the National Science Foundation (Grant CHE-1213343) and the Carbon Mitigation Initiative at Princeton University.

Read the abstract: Haji-Akbari, Amir and Pablo G. Debenedetti. 2015. Direct calculation of ice homogenous nucleation rate for a molecular model of water. Proceedings of the National Academy of Sciences Early Edition. Published online August 3, 2015.

Images courtesy of Amir Haji-Akbari, Princeton University.