Scientists predict cool new phase of superionic ice (Nature Communications)

by Tien Nguyen, Department of Chemistry

Uranus as viewed by Voyager 2 in 1986 (NASA/JPL-Caltech)
Uranus (NASA/JPL-Caltech)

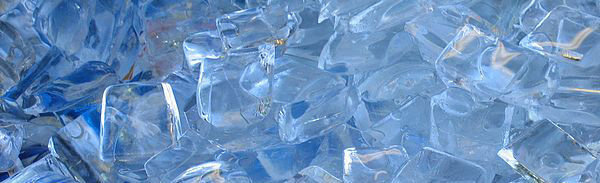
Scientists have predicted a new phase of superionic ice, a special form of ice that could exist on Uranus and Neptune, in a theoretical study performed by a team of researchers at Princeton University.

“Superionic ice is this in-between state of matter that we can’t really relate to anything we know of — that’s why it’s interesting,” Salvatore Torquato, a Professor of Chemistry who jointly led the work with Roberto Car, the Ralph W. ‘31 Dornte Professor in Chemistry. Unlike water or regular ice, superionic ice is made up of water molecules that have dissociated into charged atoms called ions, with the oxygen ions locked in a solid lattice and the hydrogen ions moving like the molecules in a liquid.

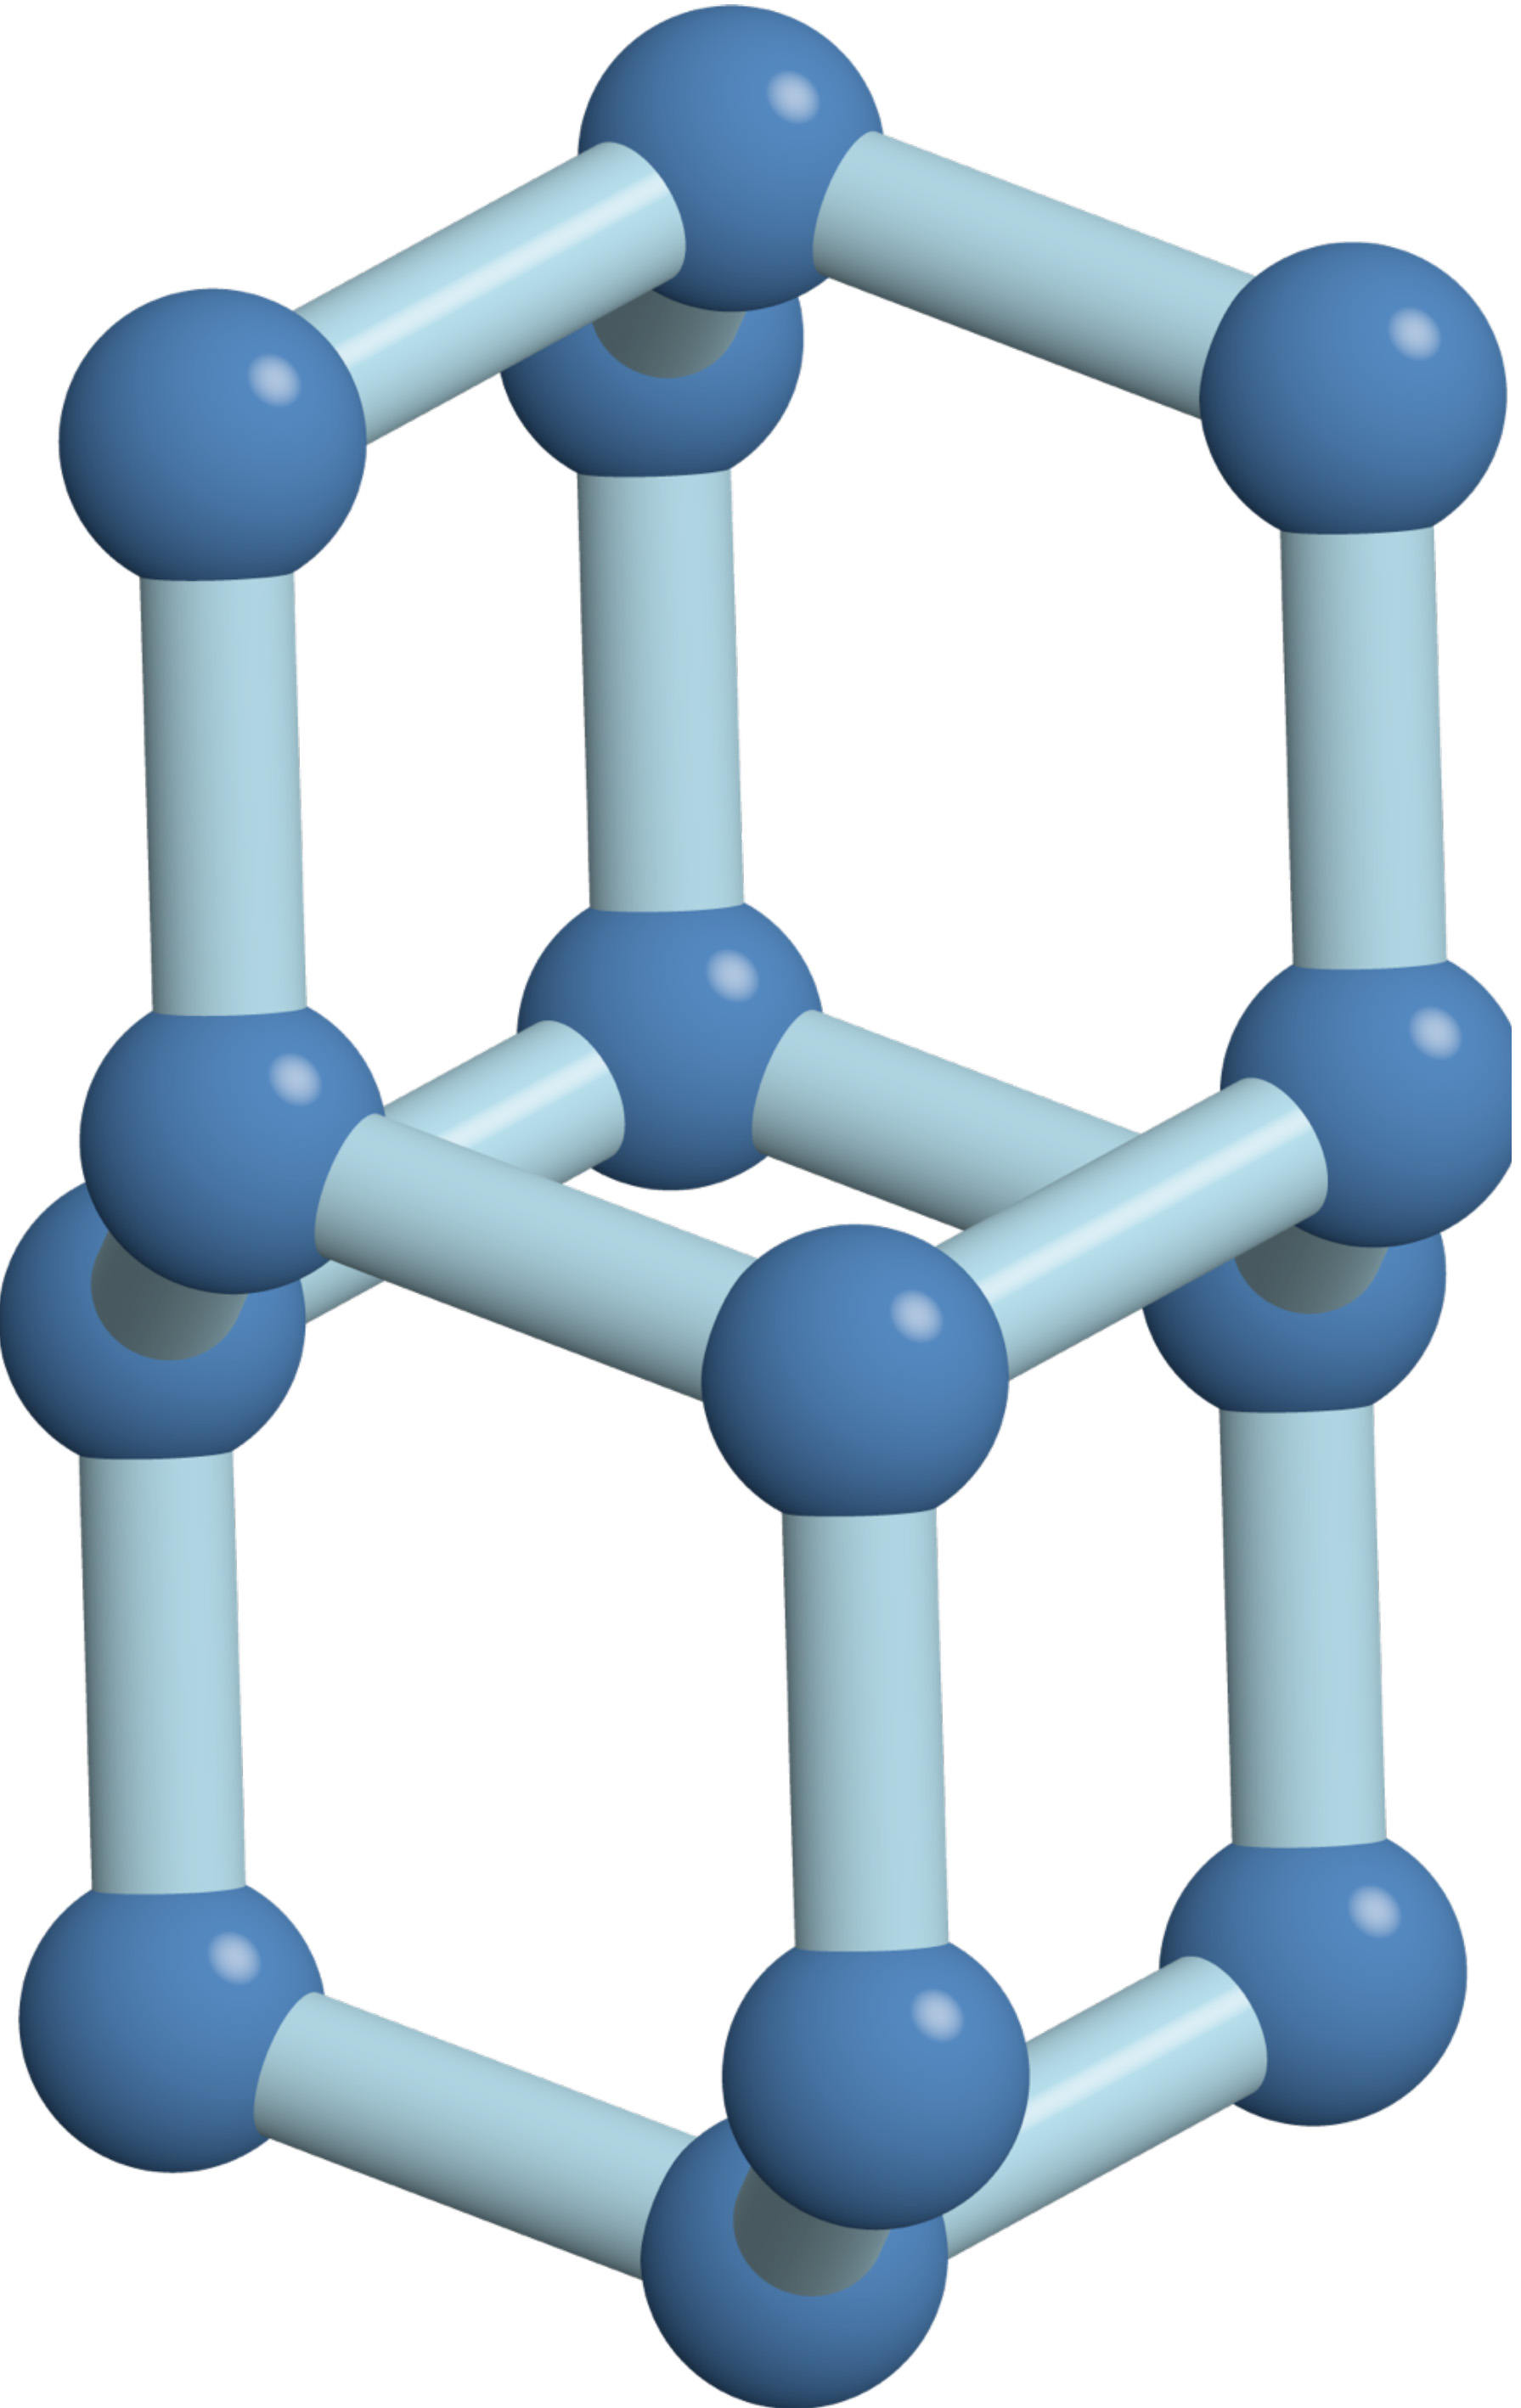
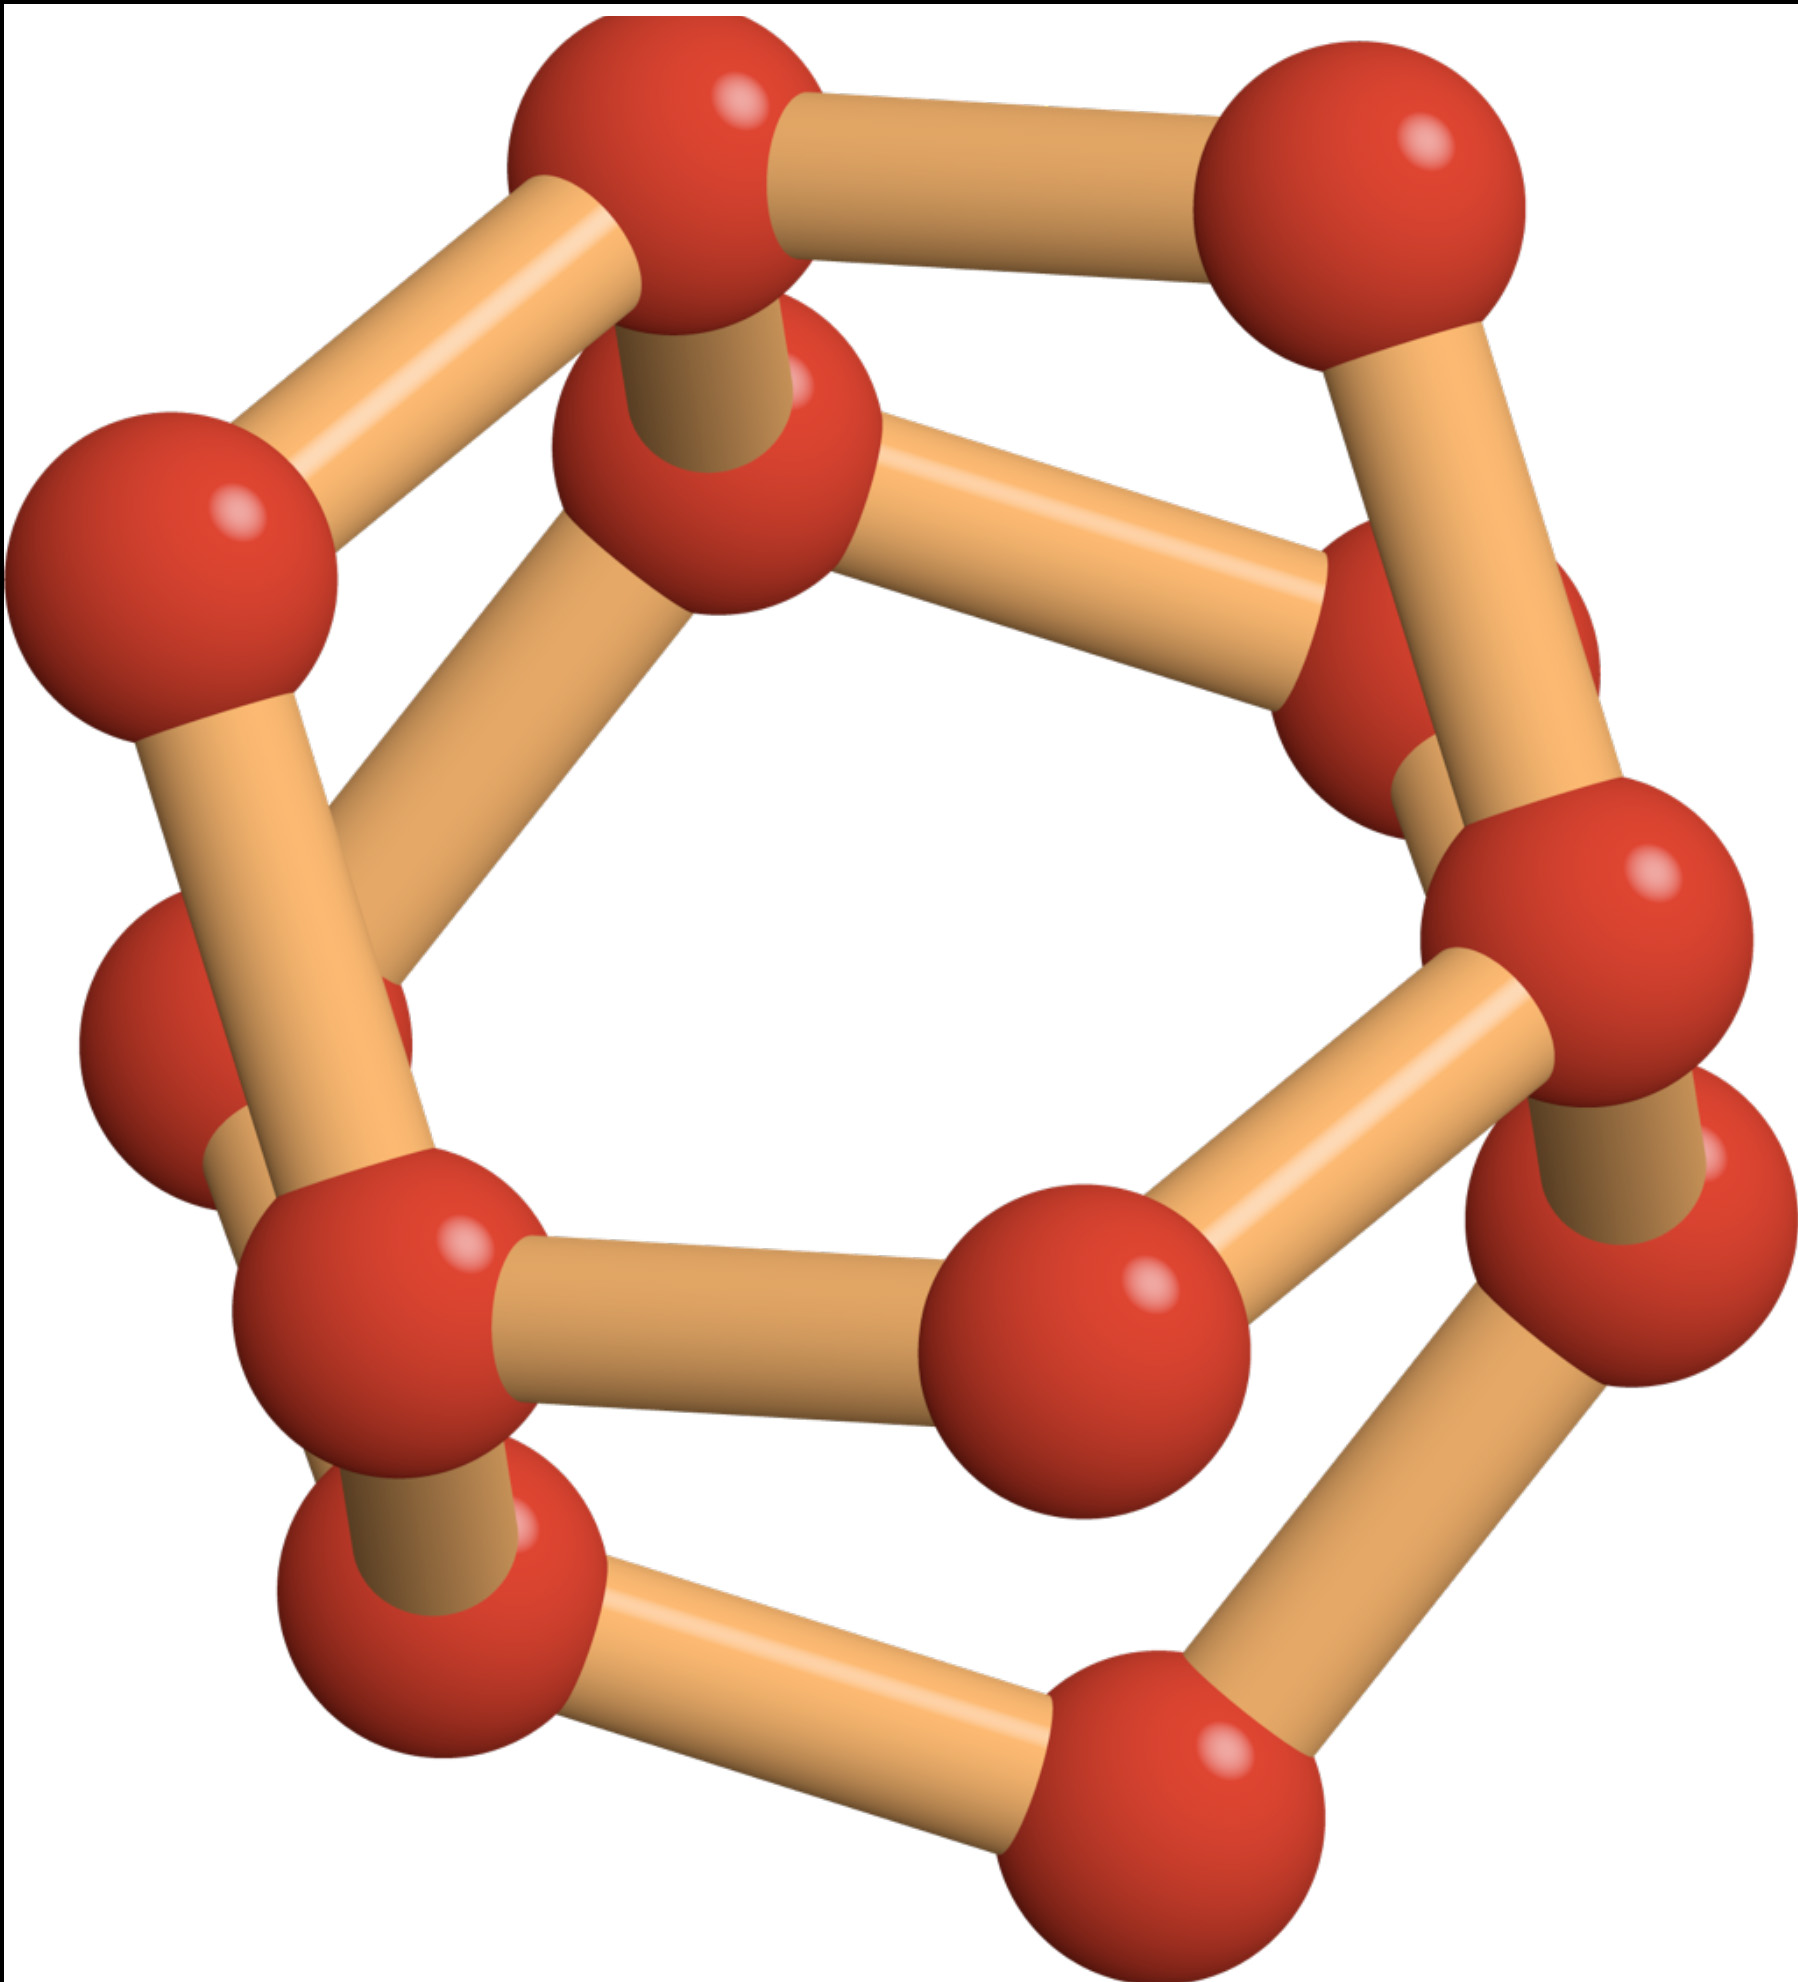
Published on August 28 in Nature Communications, the research revealed an entirely new type of superionic ice that the investigators call the P21/c-SI phase, which occurs at pressures even higher than those found in the interior of the giant ice planets of our solar system. Two other phases of superionic ice thought to exist on the planets are body-centered cubic superionic ice (BCC-SI) and close-packed superionic ice (CP-SI).

Each phase has a unique arrangement of oxygen ions that gives rise to distinct properties. For example, each of the phases allows hydrogen ions to flow in a characteristic way. The effects of this ionic conductivity may someday be observed by planetary scientists in search of superionic ice. “These unique properties could essentially be used as signatures of superionic ice,” said Torquato. “Now that you know what to look for, you have a better chance of finding it.”

Salvatore Torquato (left) and Roberto Car (right)

Unlike Earth, which has two magnetic poles (north and south), ice giants can have many local magnetic poles, which leading theories suggest may be due to superionic ice and ionic water in the mantle of these planets. In ionic water both oxygen and hydrogen ions show liquid-like behavior. Scientists have proposed that heat emanating outward from the planet’s core may pass through an inner layer of superionic ice, and through convection, create vortices on the outer layer of ionic water that give rise to local magnetic fields.

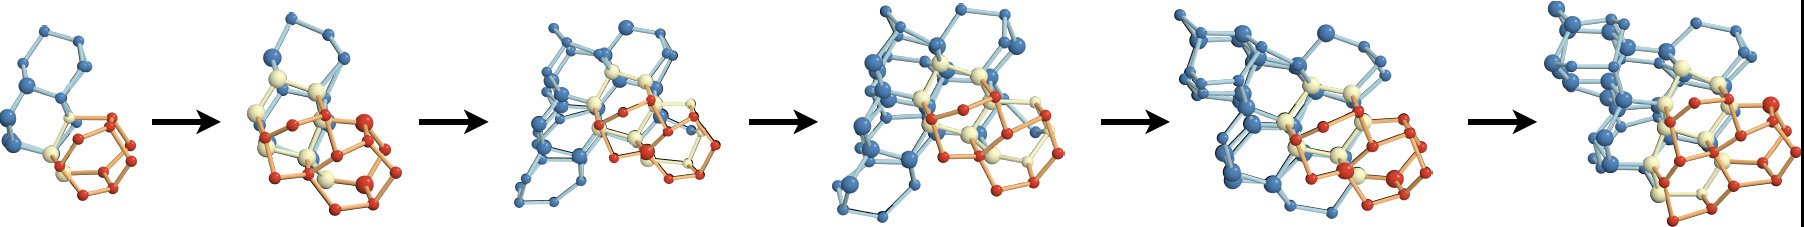
By using theoretical simulations, the researchers were able to model states of superionic ice that would be difficult to study experimentally. They simulated pressures that were beyond the highest possible pressures attainable in the laboratory with instruments called diamond anvil cells. Extreme pressure can be achieved through shockwave experiments but these rely on creating an explosion and are difficult to interpret, Professor Car explained.

The researchers calculated the ionic conductivity of each phase of superionic ice and found unusual behavior at the transition where the low temperature crystal, in which both oxygen and hydrogen ions are locked together, transforms into superionic ice. In known superionic materials, generally the conductivity can change either abruptly (type I) or gradually (type II), but the type of change will be specific to the material. However, superionic ice breaks from convention, as the conductivity changes abruptly with temperature across the crystal to close-packed superionic transition, and continuously at the crystal to P21/c-SI transition.

As a foundational study, the research team investigated superionic ice treating the ions as if they were classical particles, but in future studies they plan to take quantum effects into account to further understand the properties of the material.

Read the article here:

Sun, J.; Clark, B. K.; Torquato, S.; Car, R. “The phase diagram of high pressure superionic ice.Nature Communications, Published online August 28, 2015.

This work was supported by the National Science Foundation (DMS-1065894) and the US Department of Energy (DE-SC0008626 and DE-SC0005180).


More rain leads to fewer trees in the African savanna (PNAS)

Lone tree on savanna
More rain on African savanna leads to fewer trees, a Princeton study found. (Credit PEI)

by Angela Page for the Princeton Environmental Institute

In 2011, an influx of remote sensing data from satellites scanning the African savannas revealed a mystery: these rolling grasslands, with their heavy rainfalls and spells of drought, were home to significantly fewer trees than researchers had previously expected given the biome’s high annual precipitation. In fact, the 2011 study found that the more instances of heavy rainfall a savanna received, the fewer trees it had.

This paradox may finally have a solution due to new work from Princeton University recently published in the Proceeding of the National Academy of Sciences. In the study, researchers use mathematical equations to show that physiological differences between trees and grasses are enough to explain the curious phenomenon.

“A simple way to view this is to think of rainfall as annual income,” said Xiangtao Xu, a doctoral candidate in David Medvigy’s lab and first author on the paper. “Trees and grasses are competing over the amount of money the savanna gets every year and it matters how they use their funds.” Xu explained that when the bank is full and there is a lot of rain, the grasses, which build relatively cheap structures, thrive. When there is a deficit, the trees suffer less than grasses and therefore win out.

To establish these findings, Xu and his Princeton collaborators Medvigy, assistant professor in geosciences, and Ignacio Rodriguez-Iturbe, professor of civil and environmental engineering, created a numerical model that mimics the actual mechanistic functions of the trees and grasses. “We put in equations for how they photosynthesize, how they absorb water, how they steal water from each other—and then we coupled it all with a stochastic rainfall generator,” said Xu.

Whereas former analyses only considered total annual or monthly rainfall, understanding how rainfall is distributed across the days is critical here, Xu said, because it determines who will win in a competition between grasses and trees for the finite resource of water availability.

The stochastic rainfall generator draws on rainfall parameters derived from station observations across the savanna. By coupling it with the mechanistic equations describing how the trees and grasses function, the team was able to observe how the plants would respond under different local climate conditions.

The research team found that under very wet conditions, grasses have an advantage because they can quickly absorb water and support high photosynthesis rates. Trees, with their tougher leaves and roots, are able to survive better in dry periods because of their ability to withstand water stress. But this amounts to a disadvantage for trees in periods of intense rainfall, as they are comparatively less effective at utilizing the newly abundant water.

“We put realistic rainfall schemes into the model, then generated corresponding grass or tree abundance, and compared the numerical results with real-world observations,” Xu said. If the model looked like the real-world data, then they could say it offered a viable explanation for the unexpected phenomenon, which is not supported by traditional models—and that is exactly what they found. They tested the model using both field measurements from a well-studied savanna in Nylsvley, South Africa and nine other sites along the Kalahari Transect, as well as remote sensing data across the whole continent. With each site, the model accurately predicted observed tree abundances in those locations.

The work rejects the long held theory of root niche separation, which predicts that trees will outcompete grasses under intense rainfall when the soil becomes saturated, because their heavy roots penetrate deeper into the ground. “But this ignores the fact that grasses and trees have different abilities for absorbing and utilizing water,” Xu said. “And that’s one of the most important parts of what we found. Grasses are more efficient at absorbing water, so in a big rainfall event, grasses win.”

“Models are developed to understand and predict the past and present state — they offer a perspective on future states given the shift in climatic conditions,” said Gaby Katul, a Professor of Hydrology and Micrometeorology in the Nicholas School of the Environment at Duke University, who was not involved in the research. “This work offers evidence of how shifts in rainfall affect the tree-grass interaction because rainfall variations are large. The approach can be used not only to ‘diagnose’ the present state where rainfall pattern variations dominate but also offers a ‘prognosis’ as to what may happen in the future.”

Several high profile papers over the last decade predict that periods of intense rainfall like those described in the paper will become more frequent around the globe, especially in tropical areas, Xu said. His work suggests that these global climate changes will eventually lead to diminished tree abundance on the savannas.

“Because the savanna takes up a large area, which is home to an abundance of both wild animals and livestock, this will influence many people who live in those areas,” Xu said. “It’s important to understand how the biome would change under global climate change.”

Furthermore, the study highlights the importance of understanding the structure and pattern of rainfall, not just the total annual precipitation—which is where most research in this area has traditionally focused. Fifty years from now, a region may still experience the same overall depth of precipitation, but if the intensity has changed, that will induce changes to the abundance of grasses and trees. This, in turn, will influence the herbivores that subsist on them, and other animals in the biome — essentially, affecting the entire complex ecosystem.

Xu said it would be difficult to predict whether such changes would have positive or negative impacts. But he did say that more grasses mean more support for cows and horses and other herbivores. On the other hand, fewer trees mean less CO2 is captured out of the atmosphere, as well as diminished habitat for birds and other animals that rely on the trees for survival.

What the model does offer is an entry point for better policies and decisions to help communities adapt to future changes. “It’s just like with the weather,” Xu said. “If you don’t read the weather report, you have to take what nature gives you. But if you know in advance that it will rain tomorrow, you know to bring an umbrella.”

This work was supported by the Princeton Environmental Institute and the Andlinger Center for Energy and the Environment at Princeton University.

Read the abstract.

Xiangtao Xua, David Medvigy, and Ignacio Rodriguez-Iturbe. Relation between rainfall intensity and savanna tree abundance explained by water use strategies. Published online September 29, 2015, doi: 10.1073/pnas.1517382112. PNAS October 5, 2015.

Study calculates the speed of ice formation (PNAS)

ice_cube_bannerBy Catherine Zandonella, Office of the Dean for Research

Researchers at Princeton University have for the first time directly calculated the rate at which water crystallizes into ice in a realistic computer model of water molecules. The simulations, which were carried out on supercomputers, provide insight into the mechanism by which water transitions from a liquid to a crystalline solid.

Understanding ice formation adds to our knowledge of how cold temperatures affect both living and non-living systems, including how living cells respond to cold and how ice forms in clouds at high altitudes. A more precise knowledge of the initial steps of freezing could eventually help improve weather forecasts and climate models, as well as inform the development of better materials for seeding clouds to increase rainfall.

The researchers looked at the process by which, as the temperature drops, water molecules begin to cling to each other to form a blob of solid ice within the surrounding liquid. These blobs tend to disappear quickly after their formation. Occasionally, a large enough blob, known as a critical nucleus, emerges and is stable enough to grow rather than to melt. The process of forming such a critical nucleus is known as nucleation.

To study nucleation, the researchers used a computerized model of water that mimics the two atoms of hydrogen and one atom of oxygen found in real water. Through the computer simulations, the researchers calculated the average amount of time it takes for the first critical nucleus to form at a temperature of about 230 degrees Kelvin or minus 43 degrees Celsius, which is representative of conditions in high-altitude clouds.

They found that, for a cubic meter of pure water, the amount of time it will take for a nucleus to form is about one-millionth of a second. The study, conducted by Amir Haji-Akbari, a postdoctoral research associate, and Pablo Debenedetti, a professor of chemical and biological engineering, was published online this week in the journal Proceedings of the National Academy of Sciences.

“The main significance of this work is to show that it is possible to calculate the nucleation rate for relatively accurate models of water,” said Haji-Akbari.

Cubic ice
Cubic ice is made of double-diamond cages, each of which contains 14 water molecules arranged into seven interconnected six-member rings.
Hexagonal ice
Hexagonal ice is made of hexagonal cages, each of which contains 12 water molecules arranged into two six-membered rings that sit on top of each other.

In addition to calculating the nucleation rate, the researchers explored the origin of the two different crystalline shapes that ice can take at ambient pressure. The ice that we encounter in daily life is known as hexagonal ice. A second form, cubic ice, is less stable and can be found in high-altitude clouds. Both ices are made up of hexagonal rings, with an oxygen atom on each vertex, but the relative arrangement of the rings differs in the two structures.

“When water nucleates to form ice there is usually a combination of the cubic and hexagonal forms, but it was not well-understood why this would be the case,” said Haji-Akbari. “We were able to look at how the shapes of ice blobs change during the nucleation process, and one of the main findings of our work is to explain how a less stable form of ice is favored over the more stable hexagonal ice during the initial stages of the nucleation process.” (See figure below.)

Debenedetti added, “What we found in our simulations is that before we go to hexagonal ice we tend to form cubic ice, and that was very satisfying because this has been reported in experiments.” One of the strengths of the study, Debenedetti said, was the innovative method developed by Haji-Akbari to identify cubic and hexagonal forms in the computer simulation.

Computer models come in handy for studies of nucleation because conducting experiments at the precise temperatures and atmospheric conditions when water molecules nucleate is very difficult, said Debenedetti, who is Princeton’s Class of 1950 Professor in Engineering and Applied Science and Dean for Research. But these calculations take huge amounts of computer time.

Haji-Akbari found a way to complete the calculation, whereas previous attempts failed to do so. The technique for modeling ice formation involves looking at computer-simulated blobs of ice, known as crystallites, as they form. Normally the technique involves looking at the crystallites after every step in the simulation, but Haji-Akbari modified the procedure such that longer intervals of time could be examined, enabling the algorithm to converge to a solution and obtain a sequence of crystallites that eventually led to the formation of a critical nucleus.

Model of ice nucleation
Using a computer model to explore how water molecules connect and nucleate into ice crystals, the researchers found that two types of ice compete for dominance during nucleation: cubic ice (blue) which is less stable, and hexagonal ice (red), which is stable and forms the majority of ice on Earth. Nucleation occurs when water molecules come together to form blobs (pictured above), which grow over time (left to right). Eventually hexagonal ice wins out (not shown). The researchers found that adding new cubic features onto an existing crystalline blob gives rise to nuclei that are more spherical, and hence more stable. In contrast, adding hexagonal features tends to give rise to chains of hexagonal cages that make the nucleus less spherical, and hence less stable.

Even with the modifications, the technique took roughly 21 million computer processing unit (CPU) hours to track the behavior of 4,096 virtual water molecules in the model, which is known as TIP4P/Ice and is considered one of the most accurate molecular models of water. The calculations were carried out on several supercomputers, namely the Della and Tiger supercomputers at the Princeton Institute for Computational Science and Engineering; the Stampede supercomputer at the Texas Advanced Computing Center; the Gordon supercomputer at the San Diego Supercomputer Center; and the Blue Gene/Q supercomputer at the Rensselaer Polytechnic Institute.

Debenedetti noted that the rate of ice formation obtained in their calculations is much lower than what had been found by experiment. However, the computer calculations are extremely sensitive, meaning that small changes in certain parameters of the water model have very large effects on the calculated rate. The researchers were able to trace the discrepancy, which is 10 orders of magnitude, to aspects of the water model rather than to their method. As the modeling of water molecules improves, the researchers may be able to refine their calculations of the rate.

The research was funded by the National Science Foundation (Grant CHE-1213343) and the Carbon Mitigation Initiative at Princeton University.

Read the abstract: Haji-Akbari, Amir and Pablo G. Debenedetti. 2015. Direct calculation of ice homogenous nucleation rate for a molecular model of water. Proceedings of the National Academy of Sciences Early Edition. Published online August 3, 2015.

Images courtesy of Amir Haji-Akbari, Princeton University.

After extreme drought, forests take years to rebuild CO2 storage capacity (Science)

Drought image, provided by William AndereggBy Joe Rojas-Burke, University of Utah, and Morgan Kelly, Princeton University

In the virtual world of climate modeling, forests and other vegetation are assumed to quickly bounce back from extreme drought and resume their integral role in removing carbon dioxide from Earth’s atmosphere. Unfortunately, that assumption may be far off the mark, according to a new Princeton University-based study published in the journal Science.

An analysis of drought impacts at forest sites worldwide found that living trees took an average of two to four years to recover and resume normal growth rates — and thus carbon-dioxide absorption — after a drought ended, the researchers report. Forests help mitigate human-induced climate change by removing massive amounts of carbon-dioxide emissions from the atmosphere and incorporating the carbon into woody tissues.

The finding that drought stress sets back tree growth for years suggests that Earth’s forests are capable of storing less carbon than climate models have calculated, said lead author William Anderegg, a visiting associate research scholar in the Princeton Environmental Institute.

“This really matters because future droughts are expected to increase in frequency and severity due to climate change,” said Anderegg, who will start as an assistant professor of biology at the University of Utah in Aug. 2016. “Some forests could be in a race to recover before the next drought strikes. If forests are not as good at taking up carbon dioxide, this means climate change could speed up.”

Anderegg and colleagues measured the recovery of tree-stem growth after severe droughts at more than 1,300 forest sites around the world using records kept since 1948 by the International Tree Ring Data Bank. Tree rings provide a history of wood growth as well as carbon uptake from the surrounding ecosystem. They found that a few forests exhibited growth that was higher than predicted after drought, most prominently in parts of California and the Mediterranean.

In the majority of the world’s forests, however, trunk growth took two to four years on average to return to normal. Growth was about 9 percent slower than expected during the first year of recovery, and remained 5 percent slower in the second year. Long-lasting effects of drought were most prevalent in dry ecosystems, and among pines and tree species with low hydraulic safety margins, meaning these trees tend to keep using water at a high rate even as drought progresses, Anderegg said.

How drought causes such long-lasting harm remains unknown, but the researchers offered three possible answers: Loss of foliage and carbohydrate reserves during drought may impair growth in subsequent years; pests and diseases may accumulate in drought-stressed trees; or lasting damage to vascular tissues could impair water transport.

The researchers calculated that if a forest experiences a delayed recovery from drought, the carbon-storage capacity in semi-arid ecosystems alone would drop by about 1.6 metric gigatons over a century — an amount equal to about 25 percent of the total energy-related carbon emissions produced by the United States in a year. Yet, current climate models do not account for this massive carbon remnant of drought, Anderegg said.

“In most of our current models of ecosystems and climate, drought effects on forests switch on and off like a light,” Anderegg said. “When drought conditions go away, the models assume a forest’s recovery is complete and close to immediate. That’s not how the real world works.”

Droughts that include high temperatures—as opposed to only low precipitation—are a documented scourge to tree growth and health, Anderegg said. During the 2000-2003 drought in the American Southwest, for instance, the decrease in precipitation was comparable to earlier droughts, but the temperature was hotter than the long-term average by 3 to 6 degrees Fahrenheit.

“The higher temperatures really seemed to make the drought lethal to vegetation where previous droughts with the same rainfall deficit weren’t,” Anderegg said.

“Drought, especially the type that matters to forests, is about the balance between precipitation and evaporation, and evaporation is very strongly linked to temperature,” he said. “The fact that temperatures are going up suggests quite strongly that the western regions of the United States are going to have more frequent and more severe droughts, which would substantially reduce forests’ ability to pull carbon from the atmosphere.”

Anderegg co-authored the study with Princeton colleagues Stephen Pacala, the Frederick D. Petrie Professor in Ecology and Evolutionary Biology; Adam Wolf, an associate research scholar in ecology and evolutionary biology; and Elena Shevliakova, a senior climate modeler in ecology and evolutionary biology and in the National Oceanic and Atmospheric Administration’s (NOAA) Geophysical Fluid Dynamics Laboratory (GFDL) located on Princeton’s Forrestal Campus.

The research also included collaborators from Northern Arizona University, University of Nevada–Reno, Pyrenean Institute Of Ecology, University of New Mexico, Arizona State University, the U.S. Forest Service Rocky Mountain Research Station, and the Lamont-Doherty Earth Observatory of Columbia University.

Read the abstract.

The research was funded by the National Science Foundation (grant number DEB EF-1340270) and the NOAA Climate and Global Change Postdoctoral Fellowship program.