PFinal – Name Redacted

Group 20 – Name Redacted

Brian, Ed, Matt, and Josh

Description: Our group is cre­at­ing an inter­ac­tive and fun way for students and others who do not know computer science to learn the fun­da­men­tals of com­puter sci­ence with­out the need for expen­sive soft­ware and/or hardware.

P1 – https://blogs.princeton.edu/humancomputerinterface/2013/02/22/p1-name-redacted/

P2 – https://blogs.princeton.edu/humancomputerinterface/2013/03/11/p2-name-redacted/

P3 – https://blogs.princeton.edu/humancomputerinterface/2013/03/29/p3-name-redacted/

P4 – https://blogs.princeton.edu/humancomputerinterface/2013/04/08/p4-name-redacted/

P5 – https://blogs.princeton.edu/humancomputerinterface/2013/04/22/p5-name-redacted/

P6 – https://blogs.princeton.edu/humancomputerinterface/2013/05/06/p6-name-redacted/

Video:

http://www.youtube.com/watch?v=qSJOHOulwMI

This video shows a compilation error that is detected by the TOY Program.  It tells the user where the error occurred and what the arguments of the command should be.

http://www.youtube.com/watch?v=YD4E56iZWfI

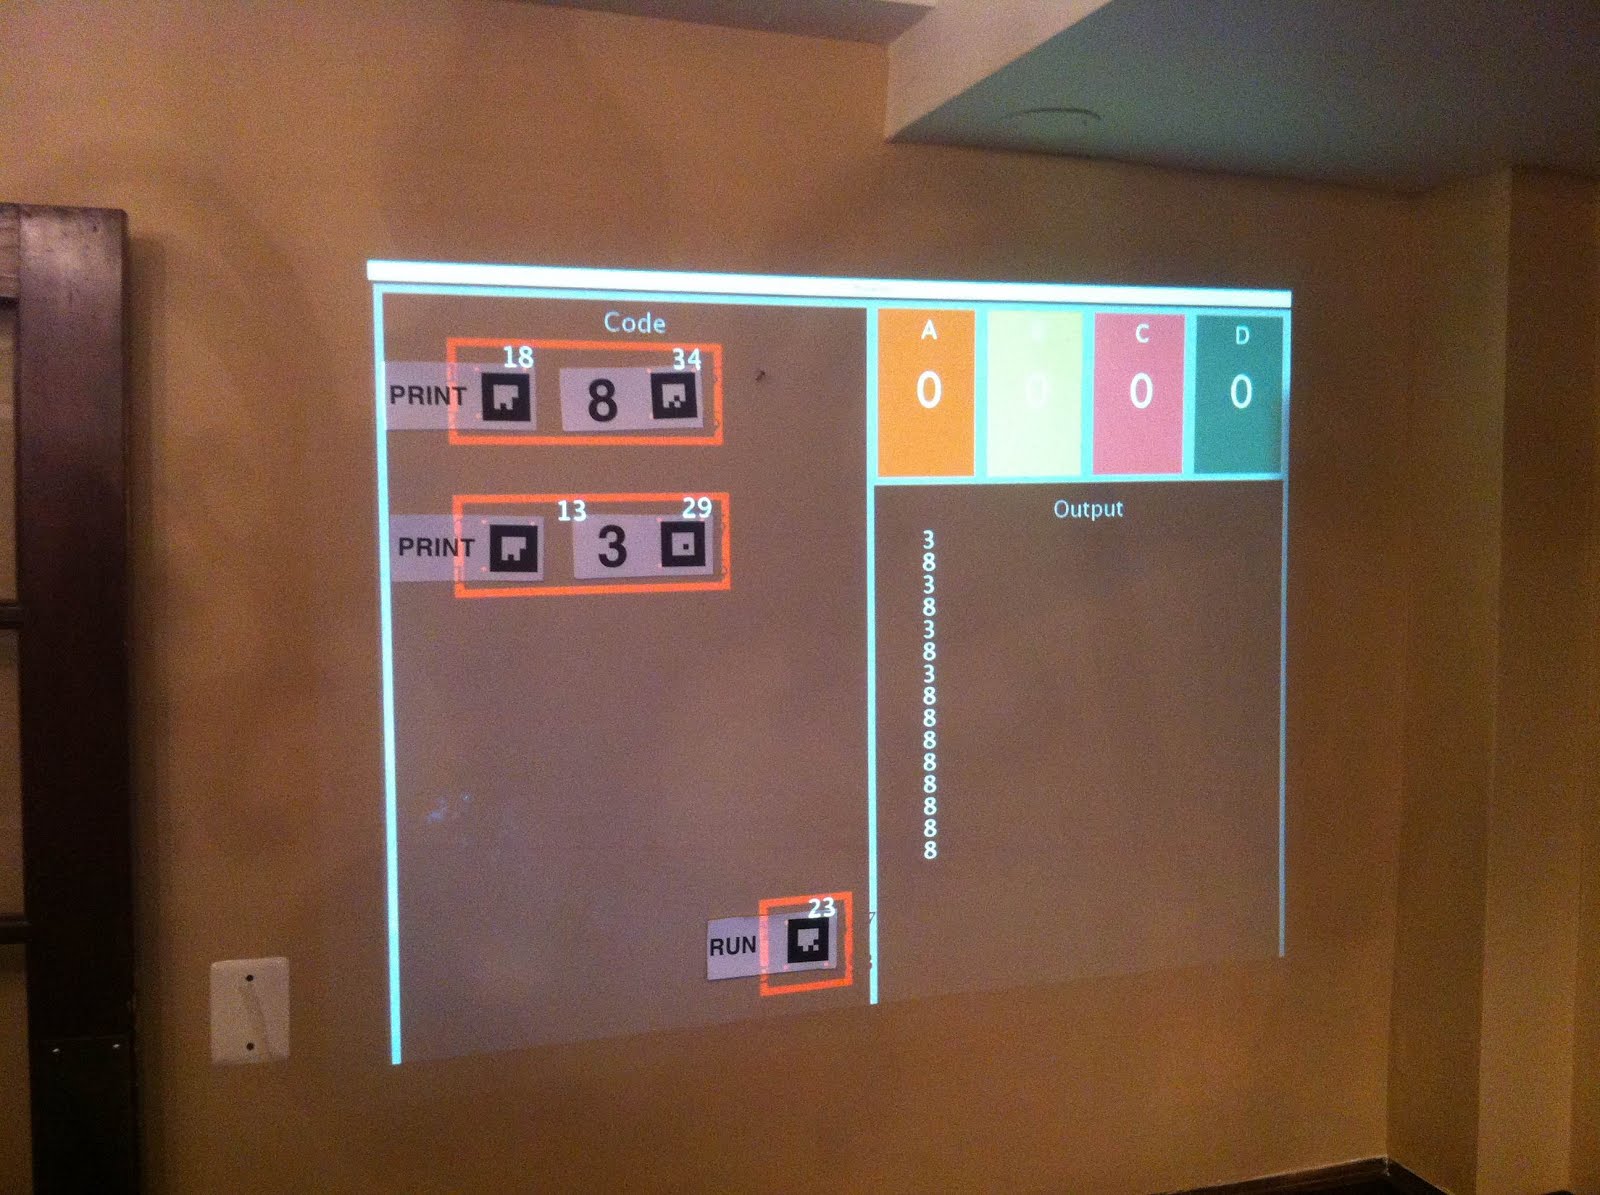
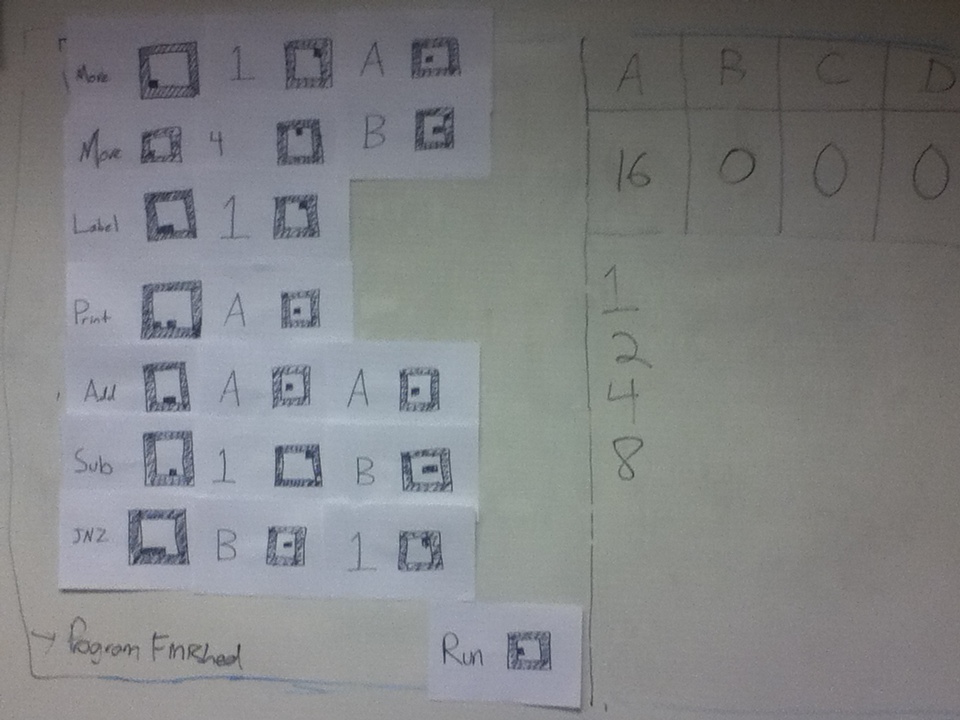
This video shows a TOY Program that prints out the numbers from 5 to 1 in descending order.The program takes 1.5 seconds to execute each step so that a user can see the program progress.  There is an arrow that is over the line that is currently being executed.

http://www.youtube.com/watch?v=RO5azUA_Vtw
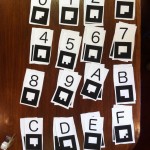
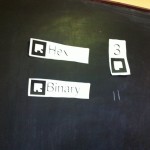
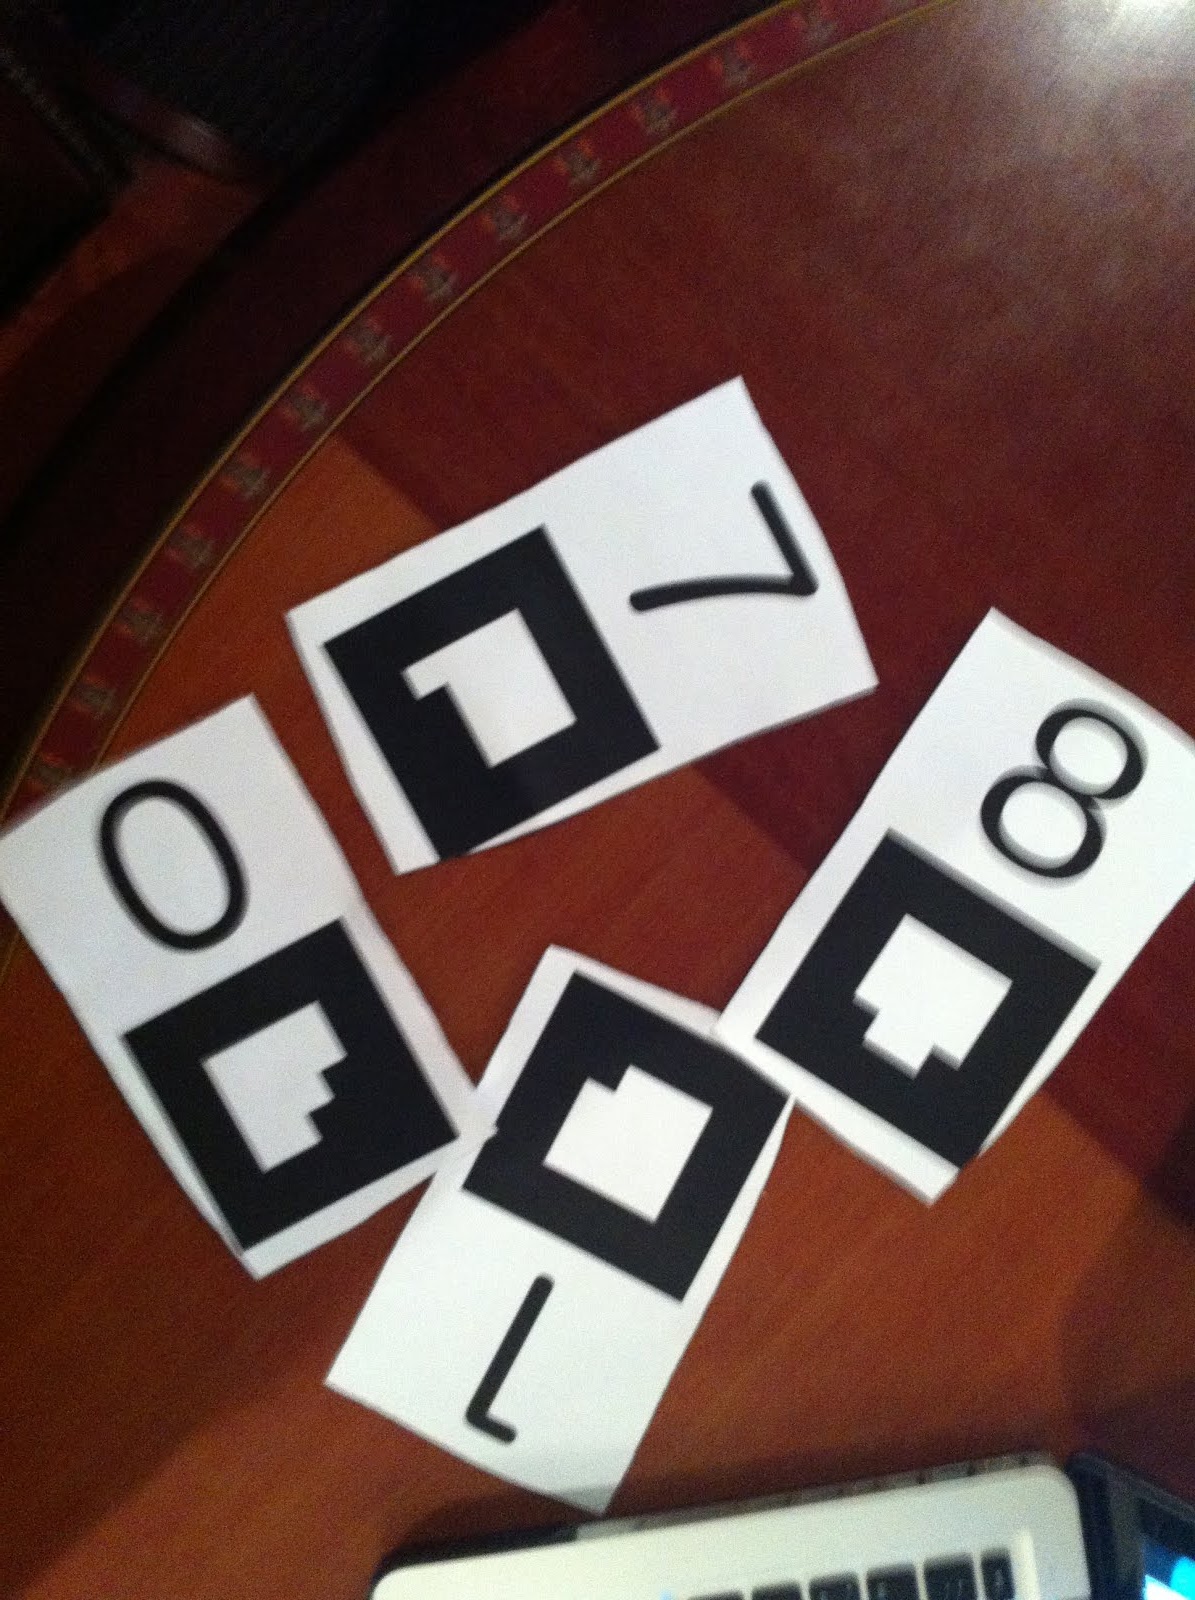
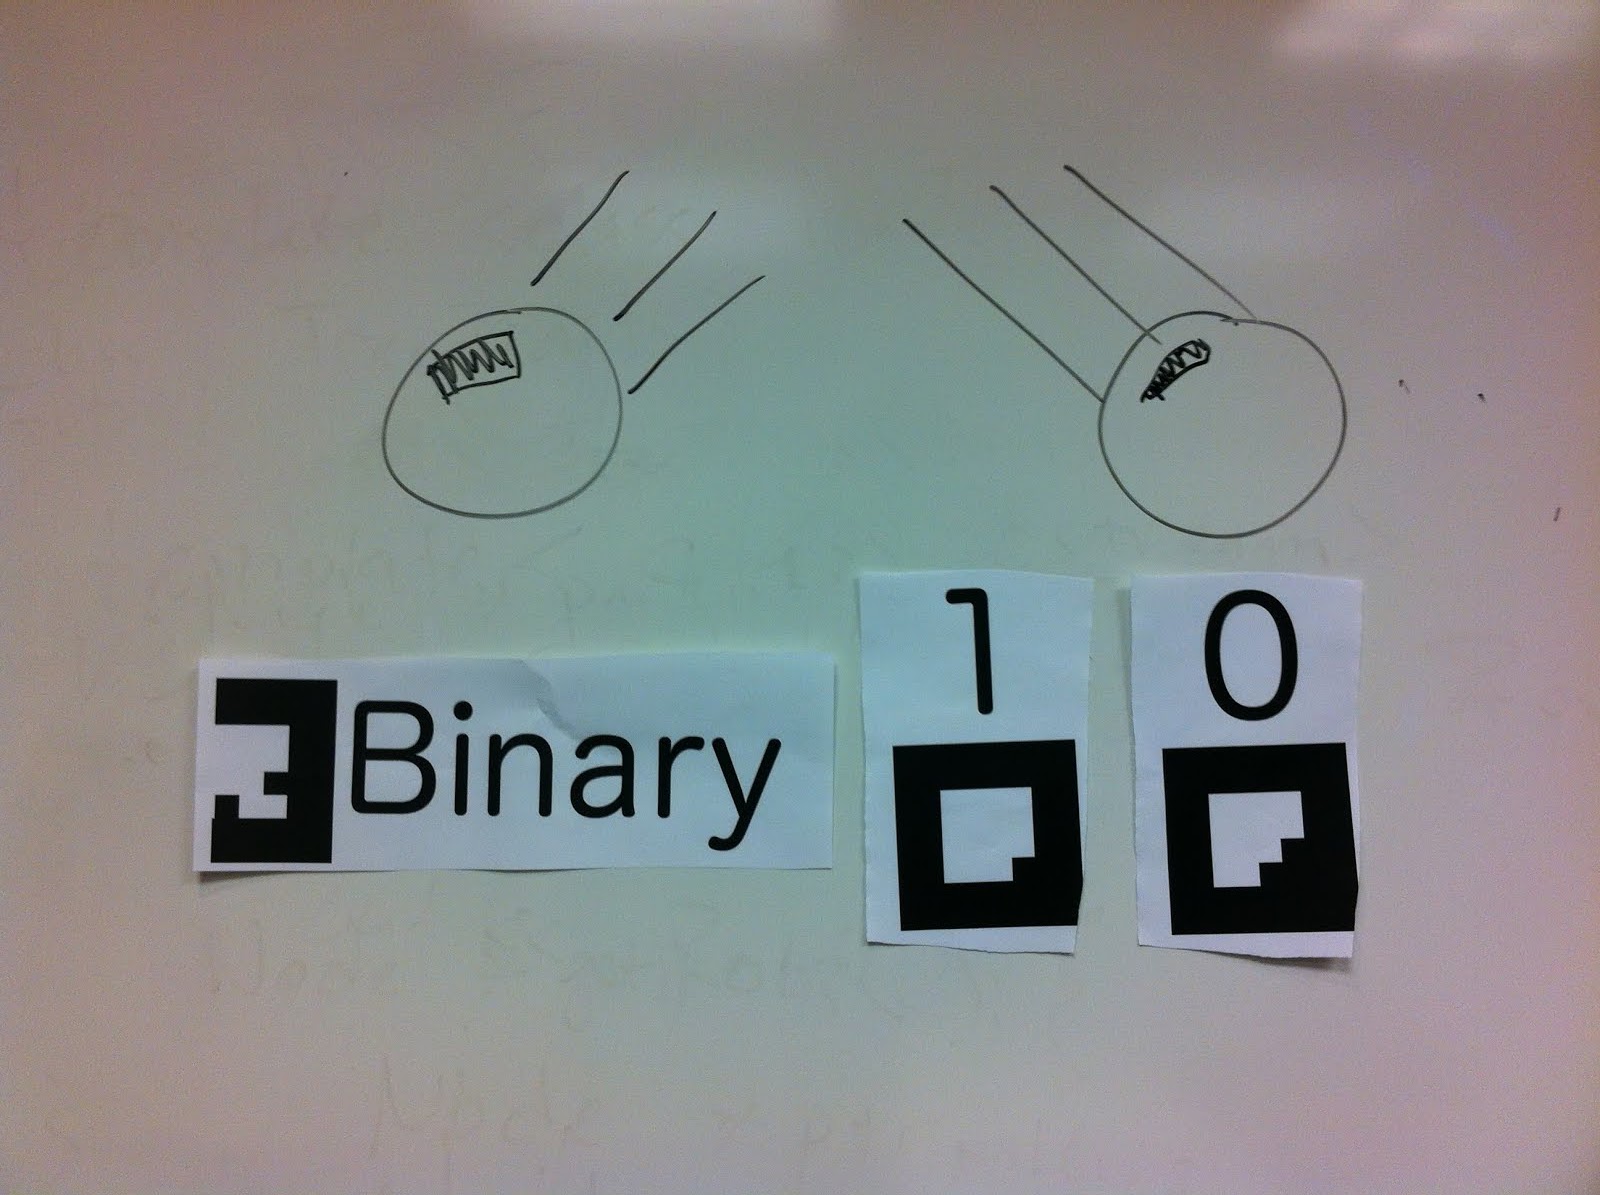
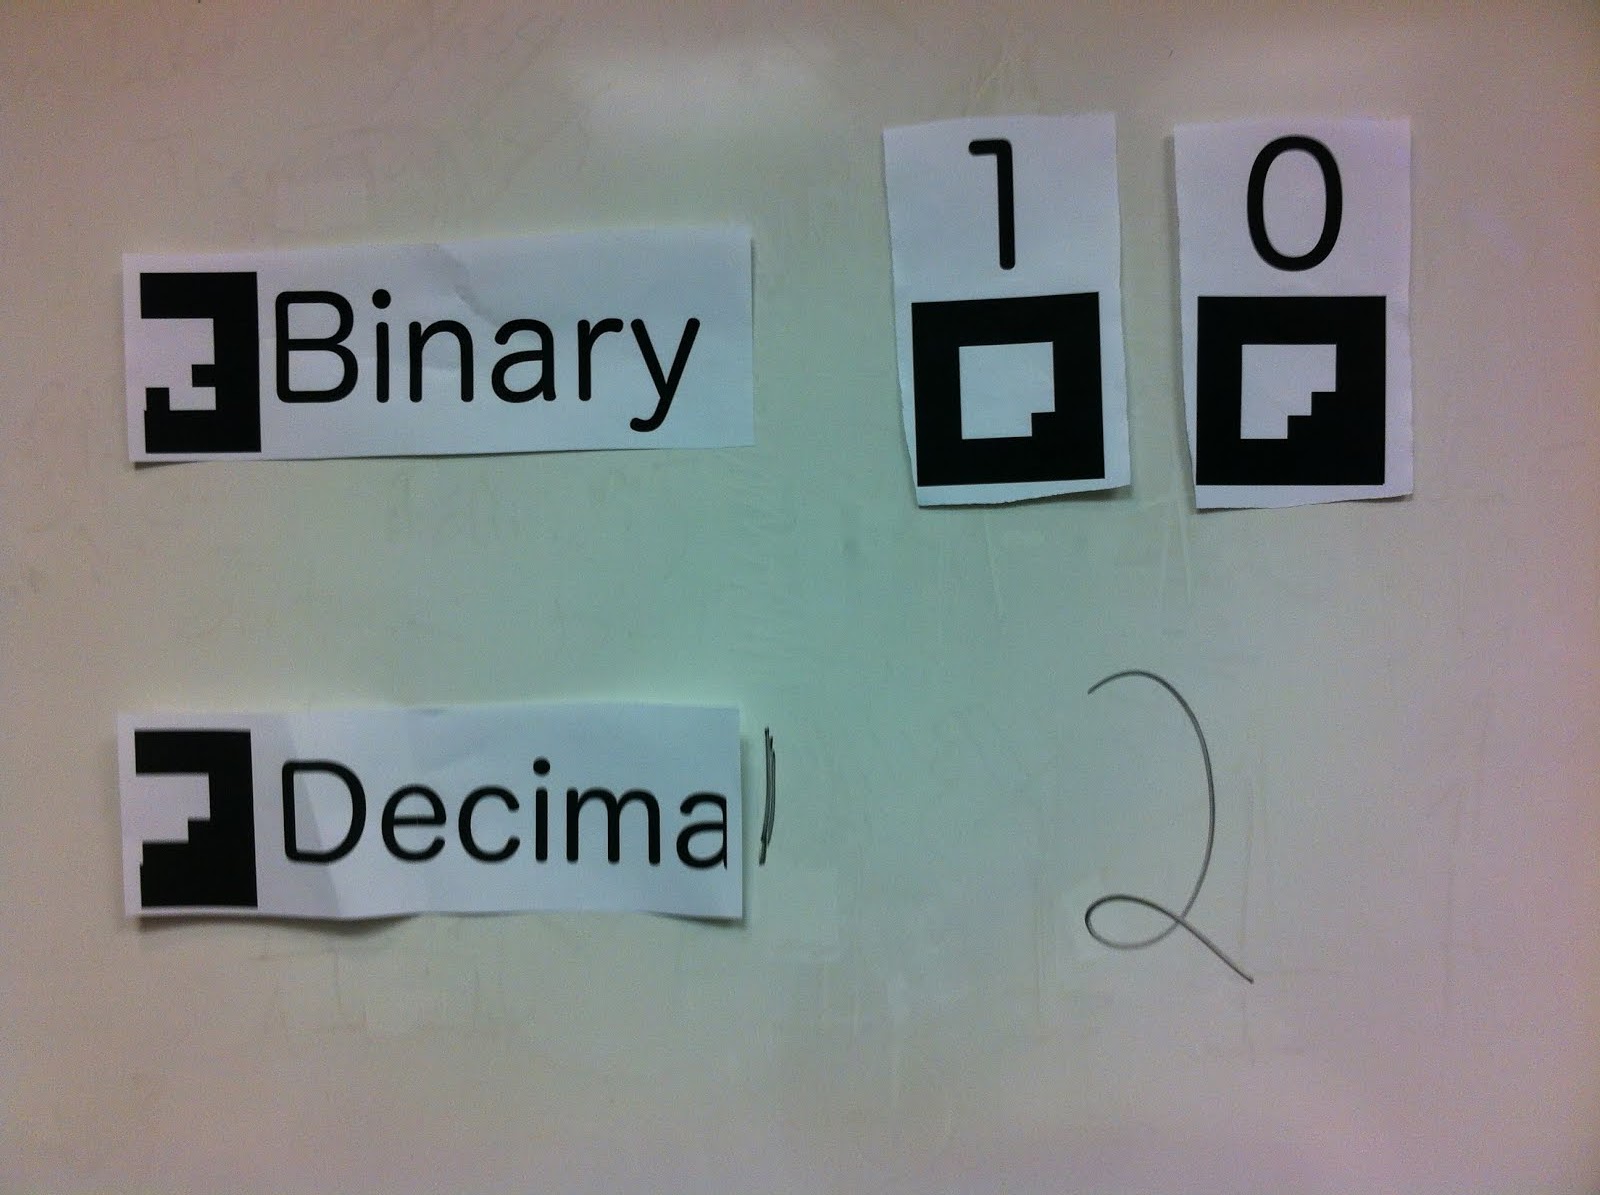
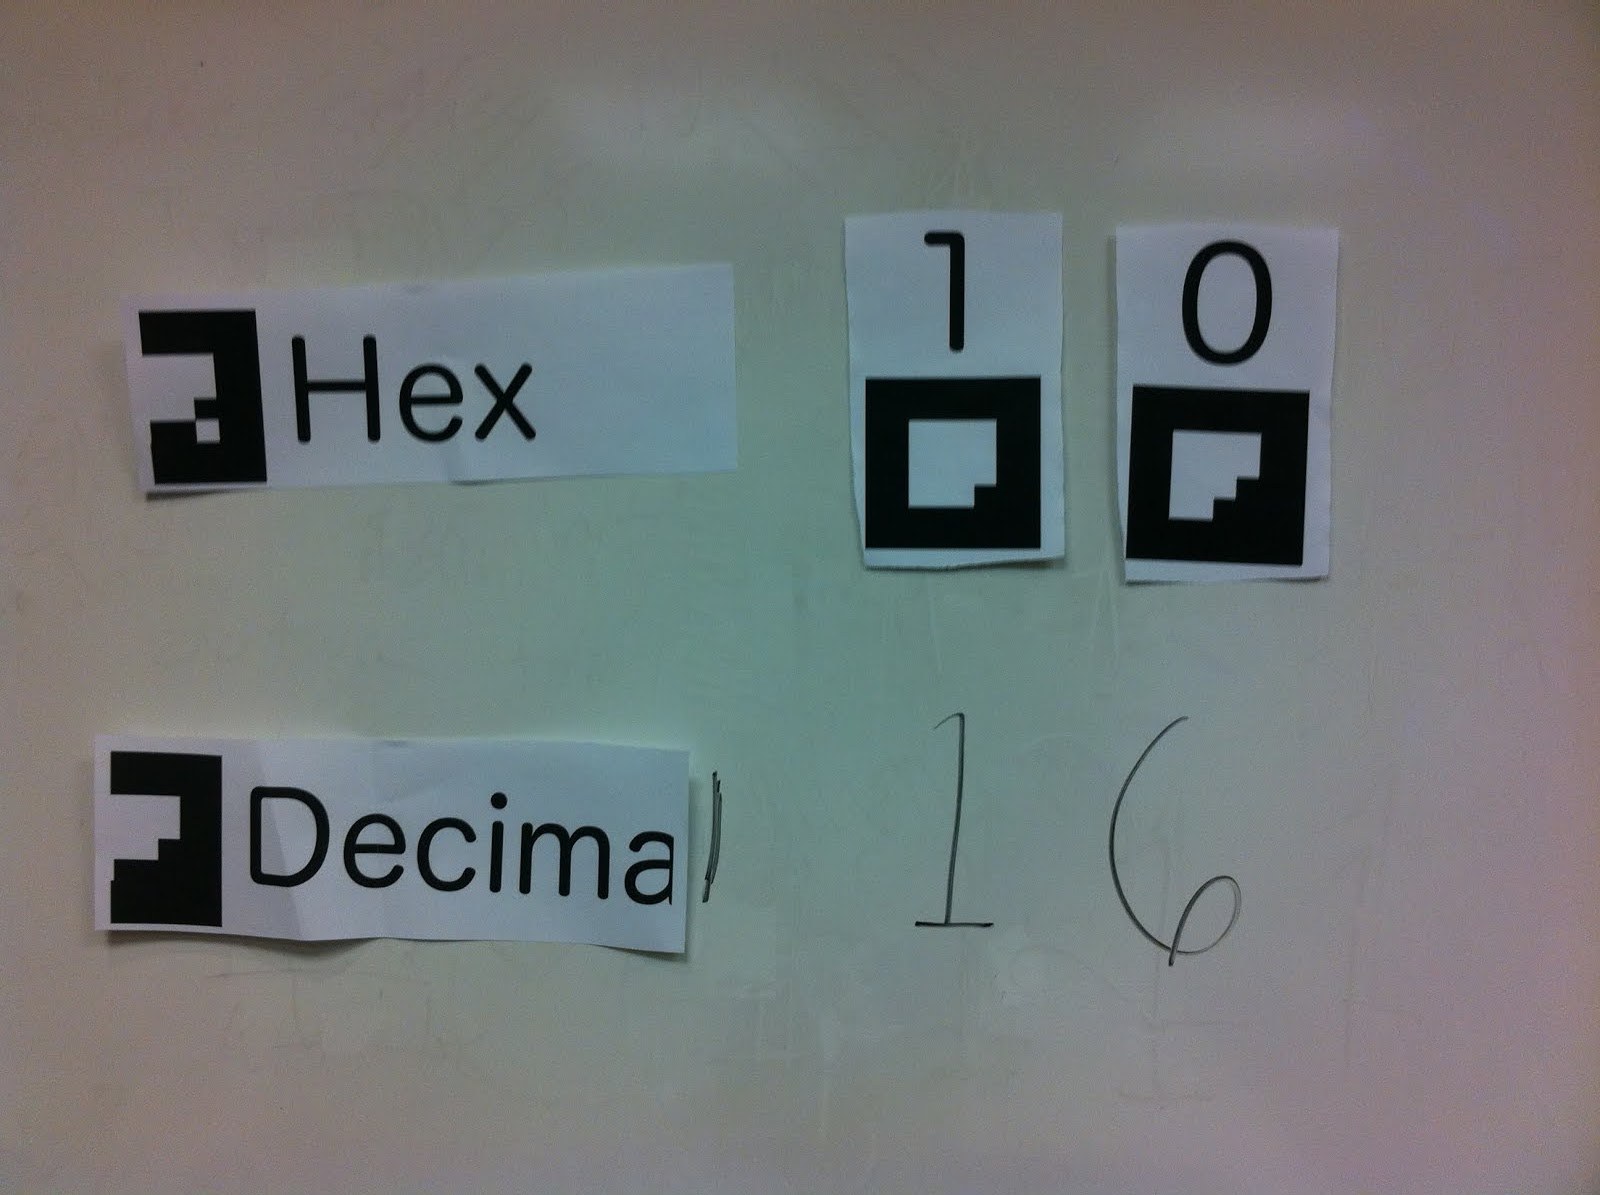
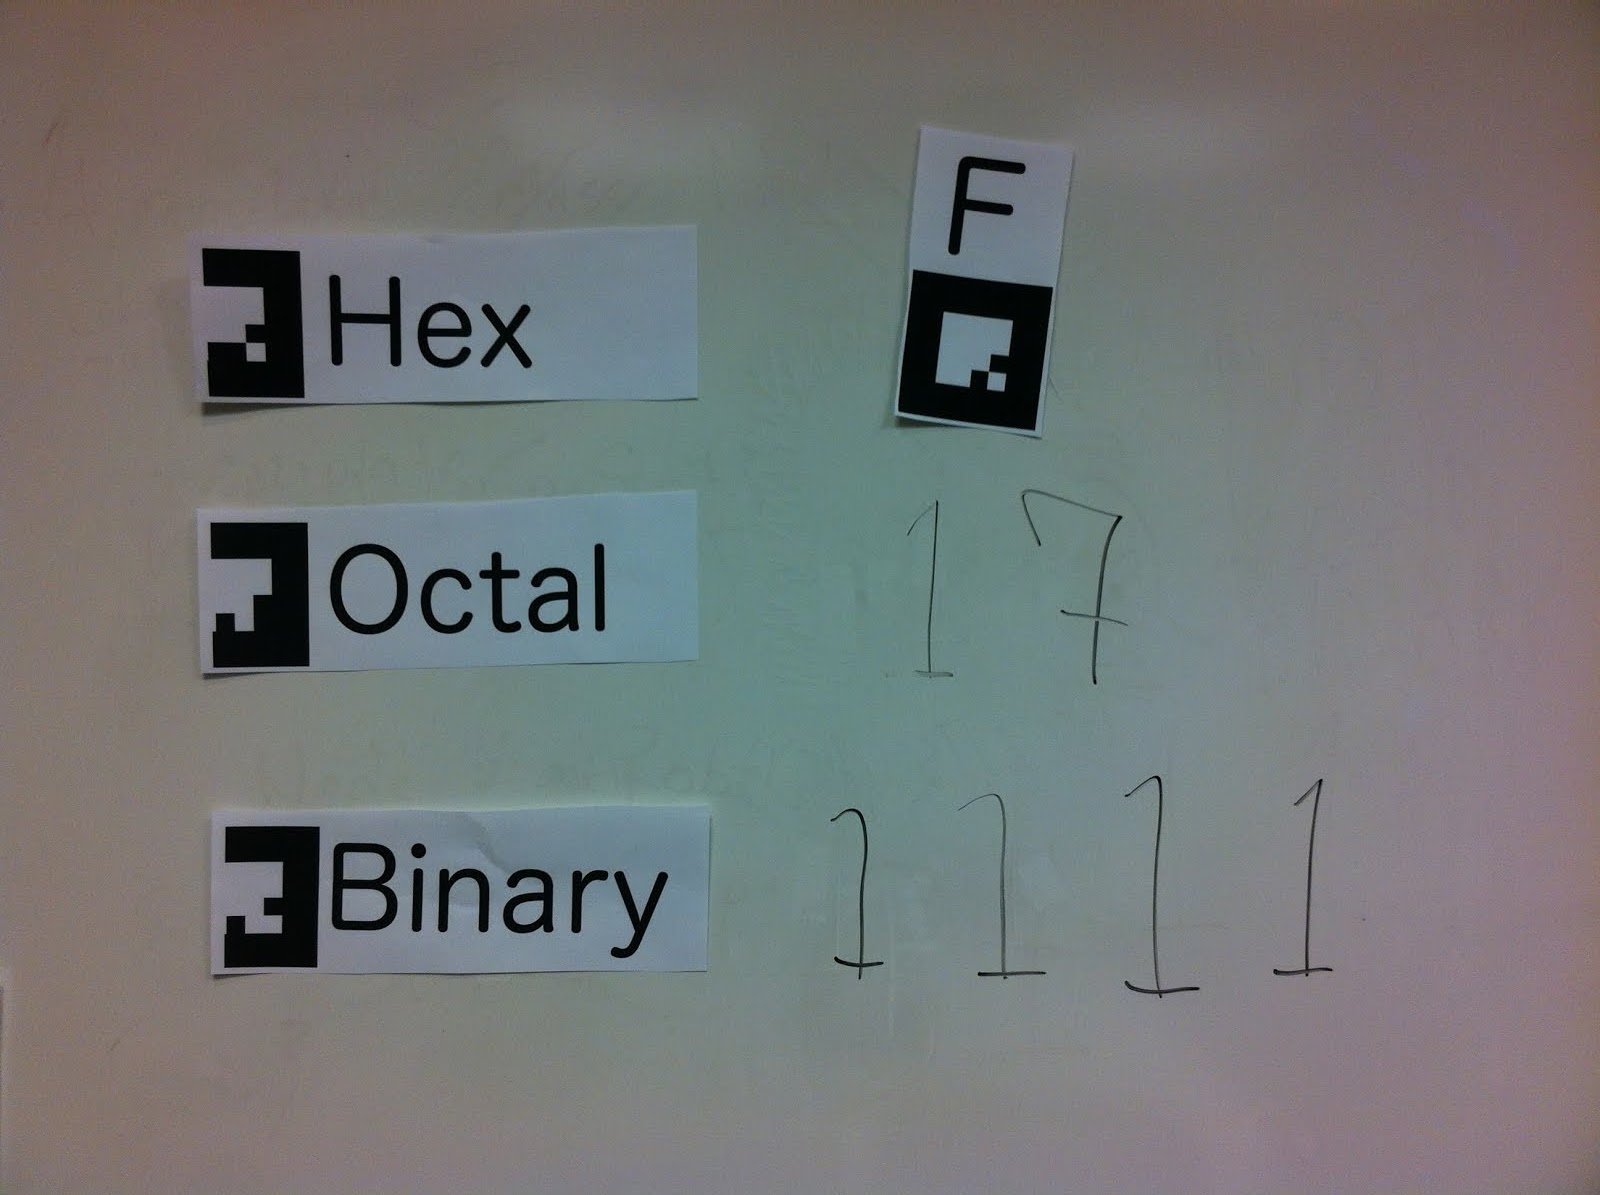
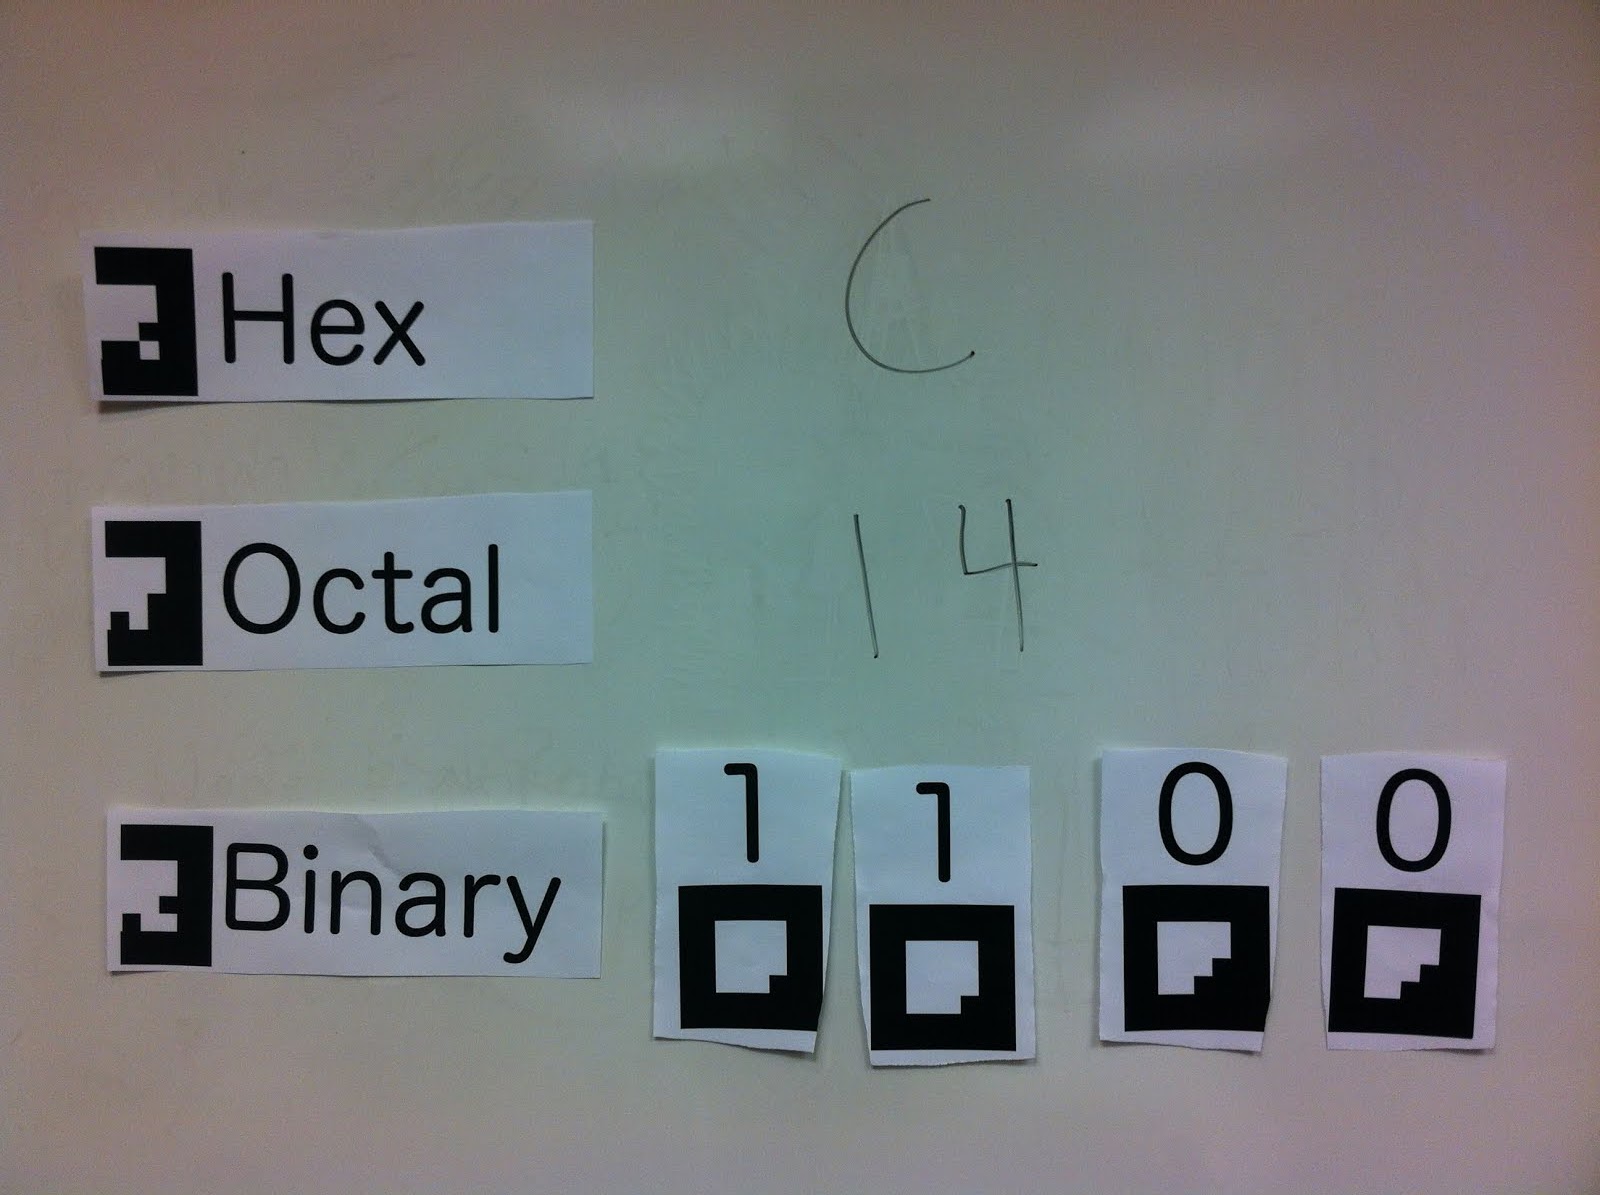
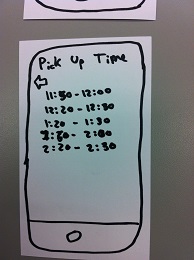
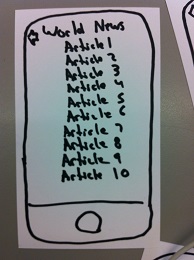
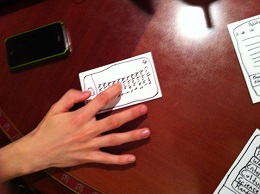
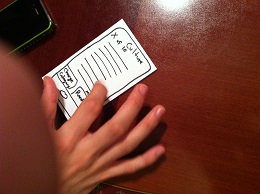
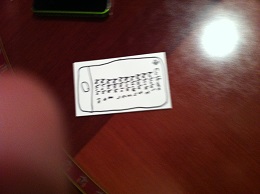
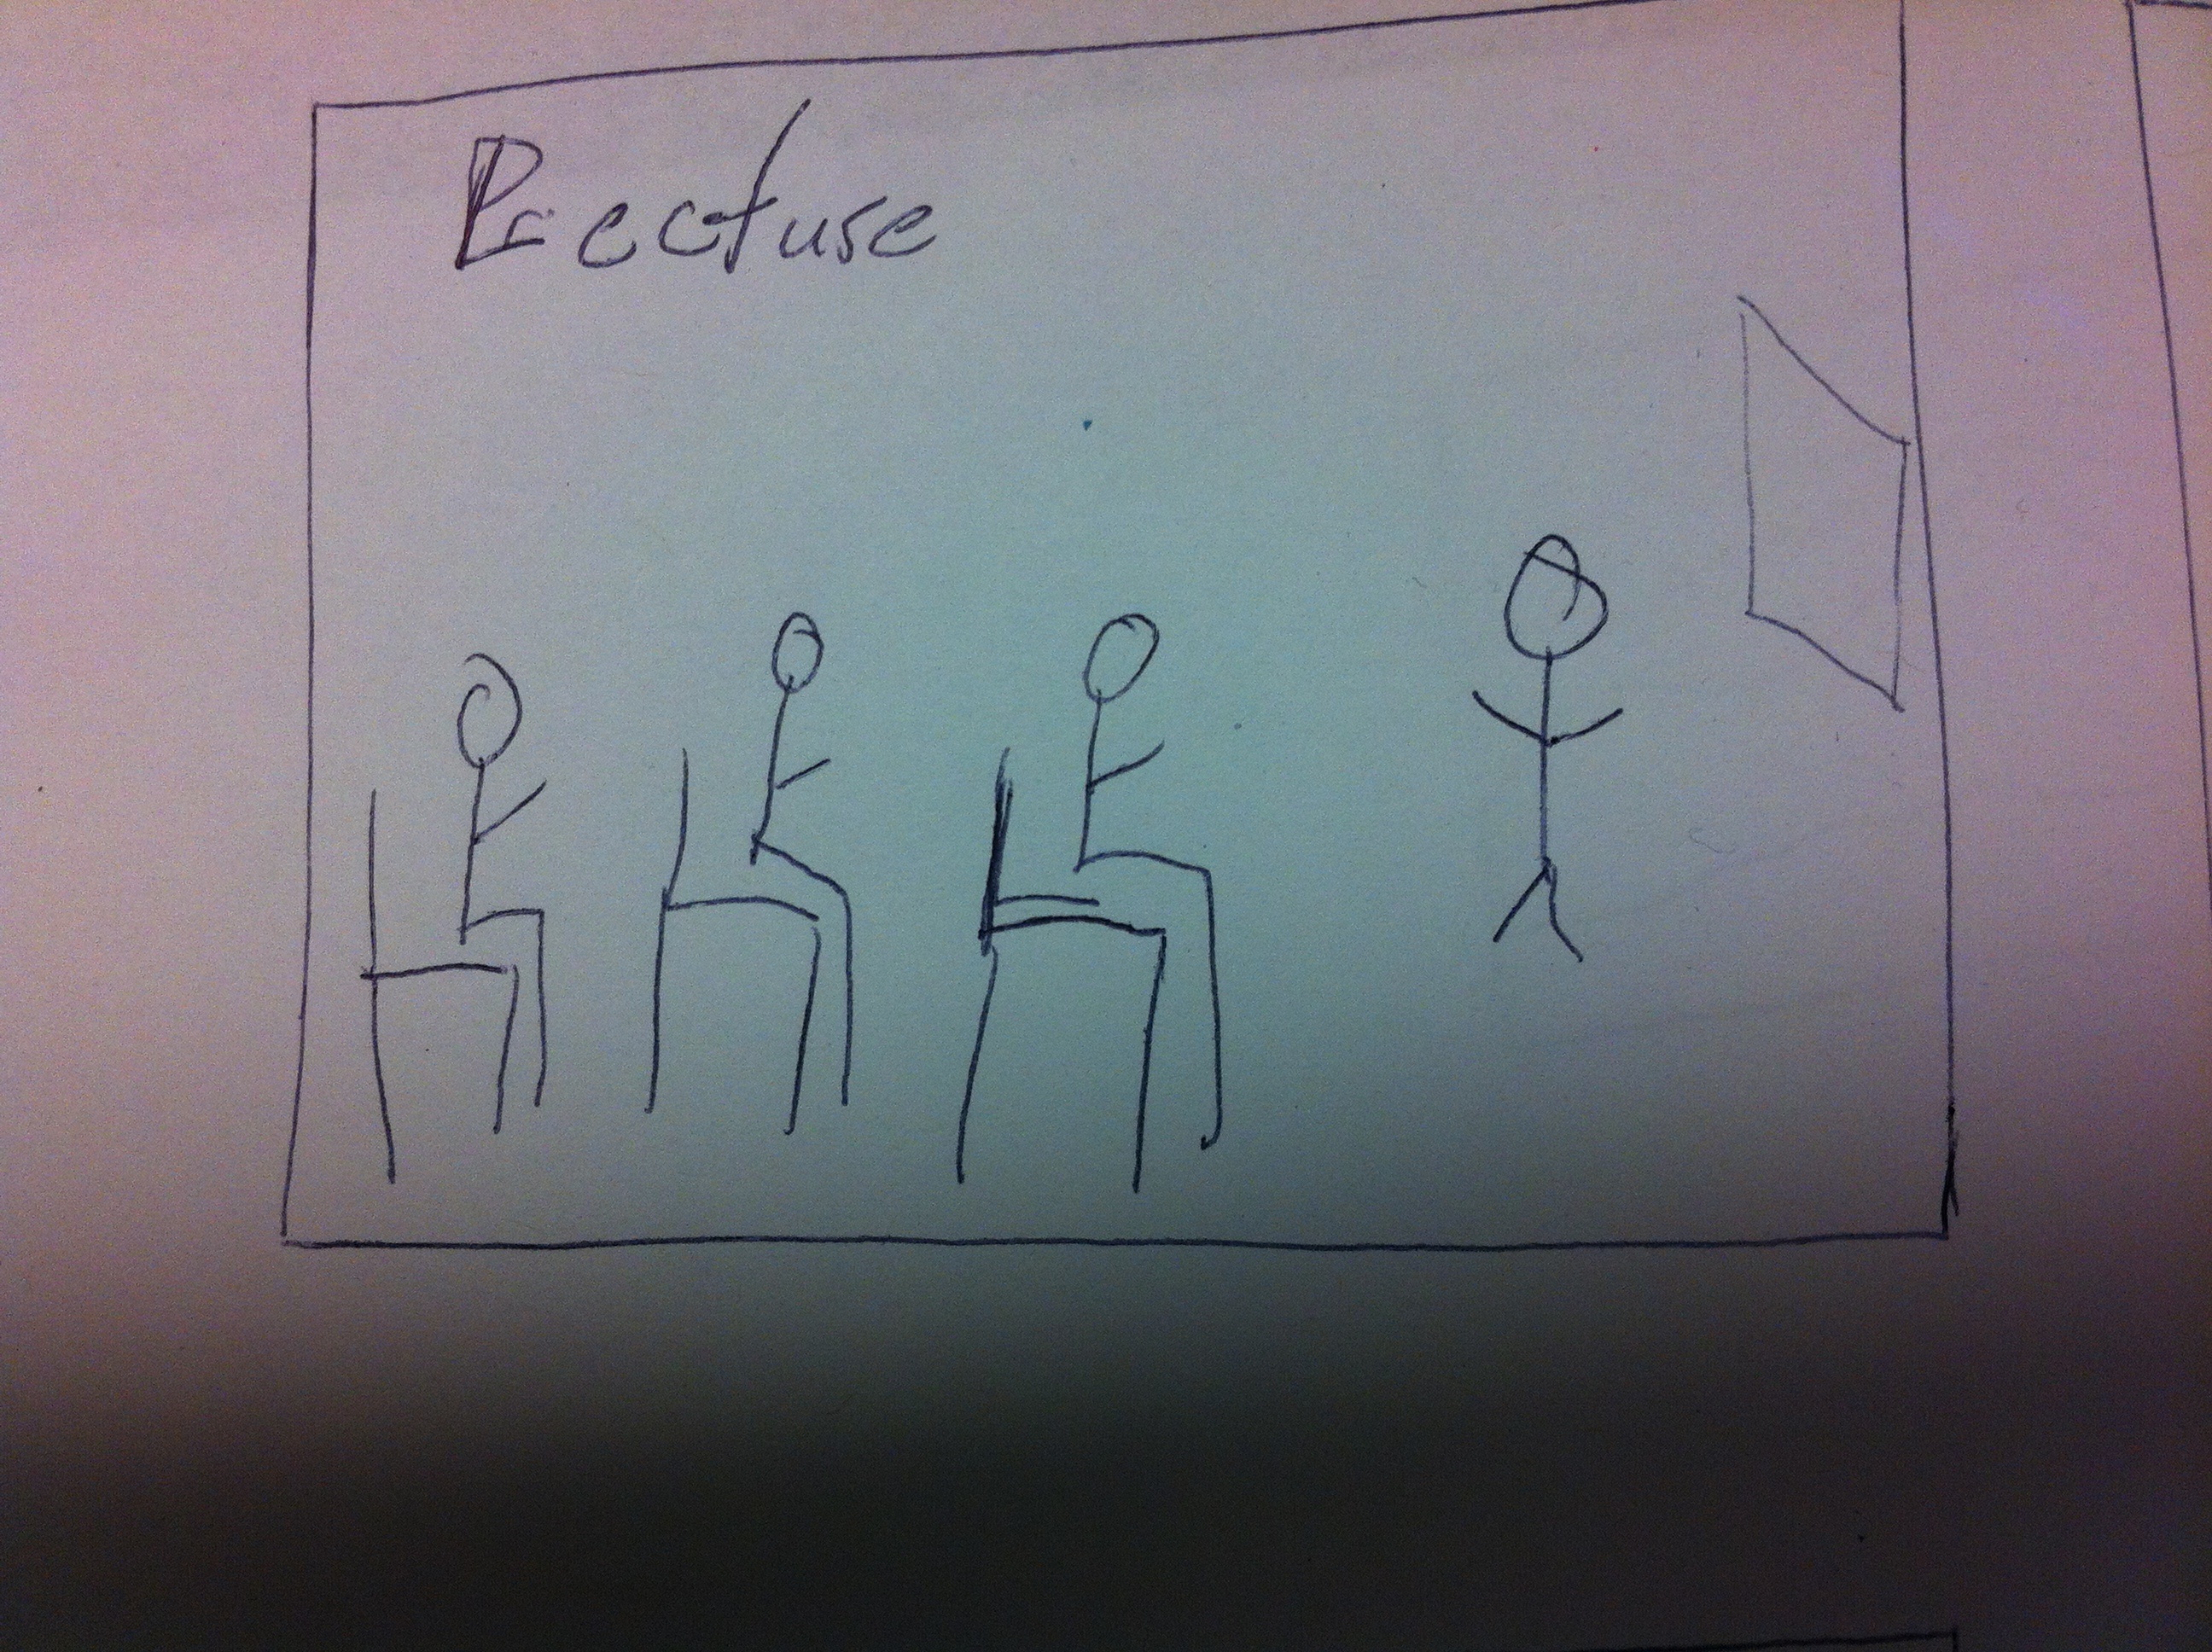
Number Bases

Bulleted List of Changes:

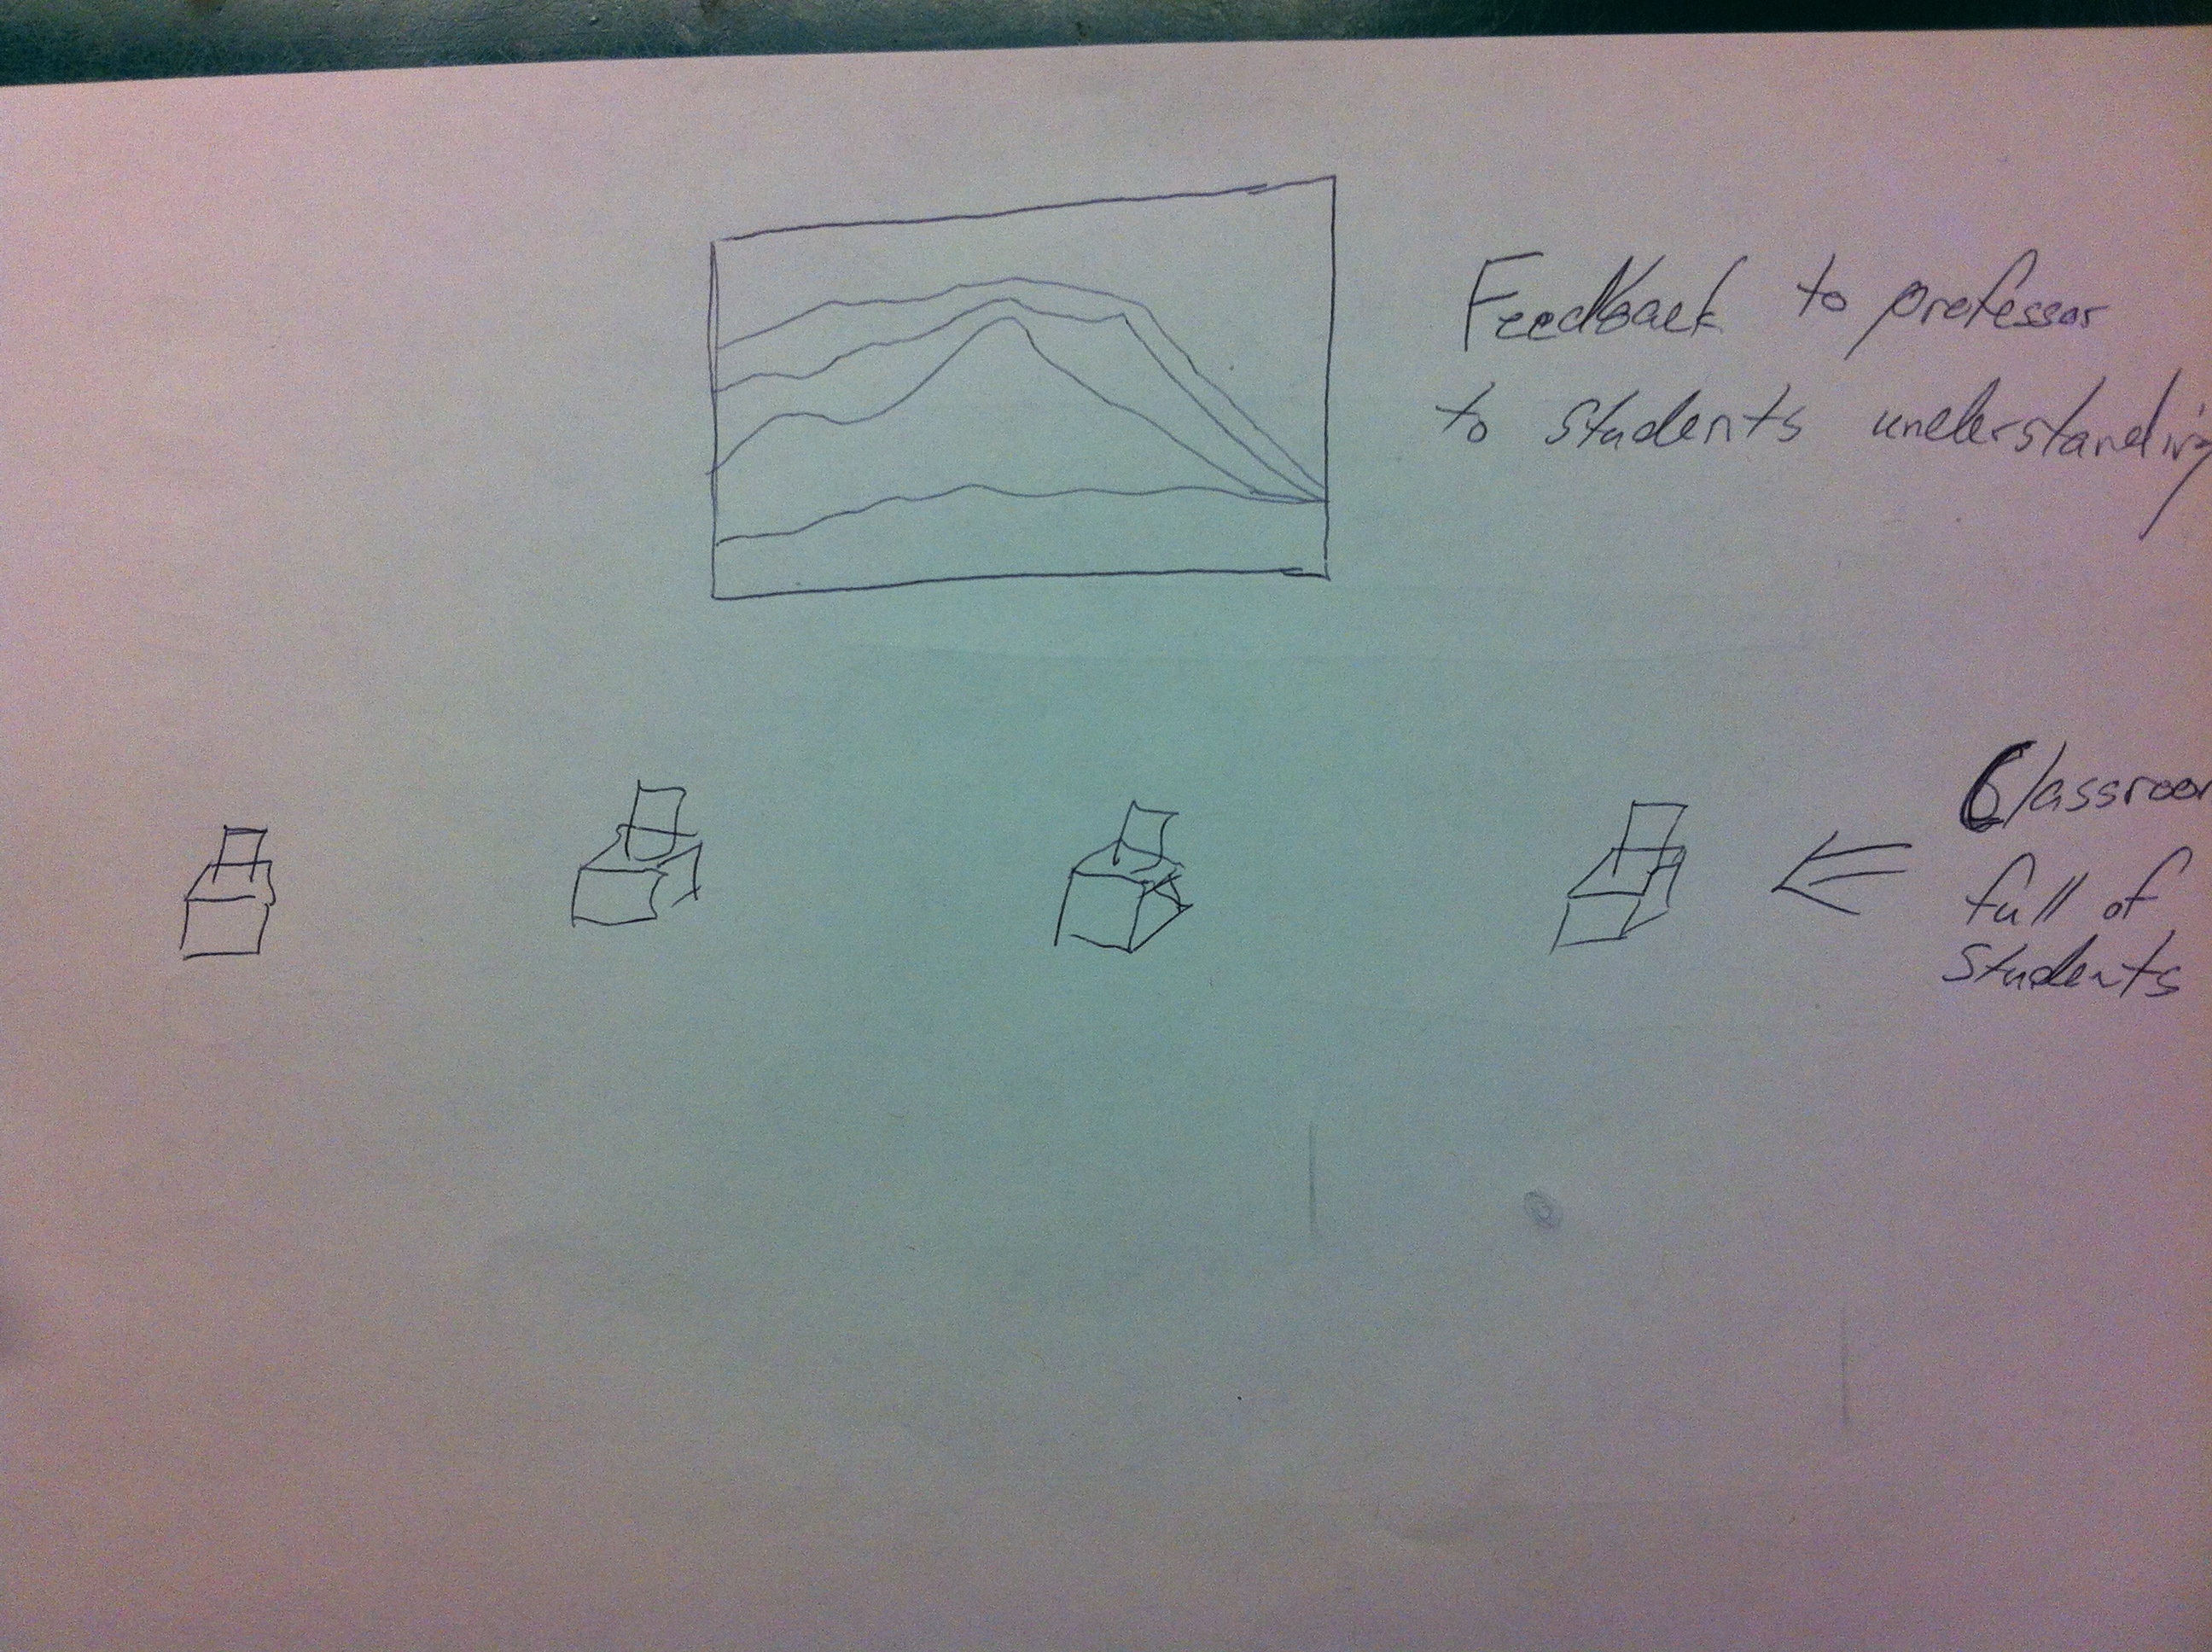
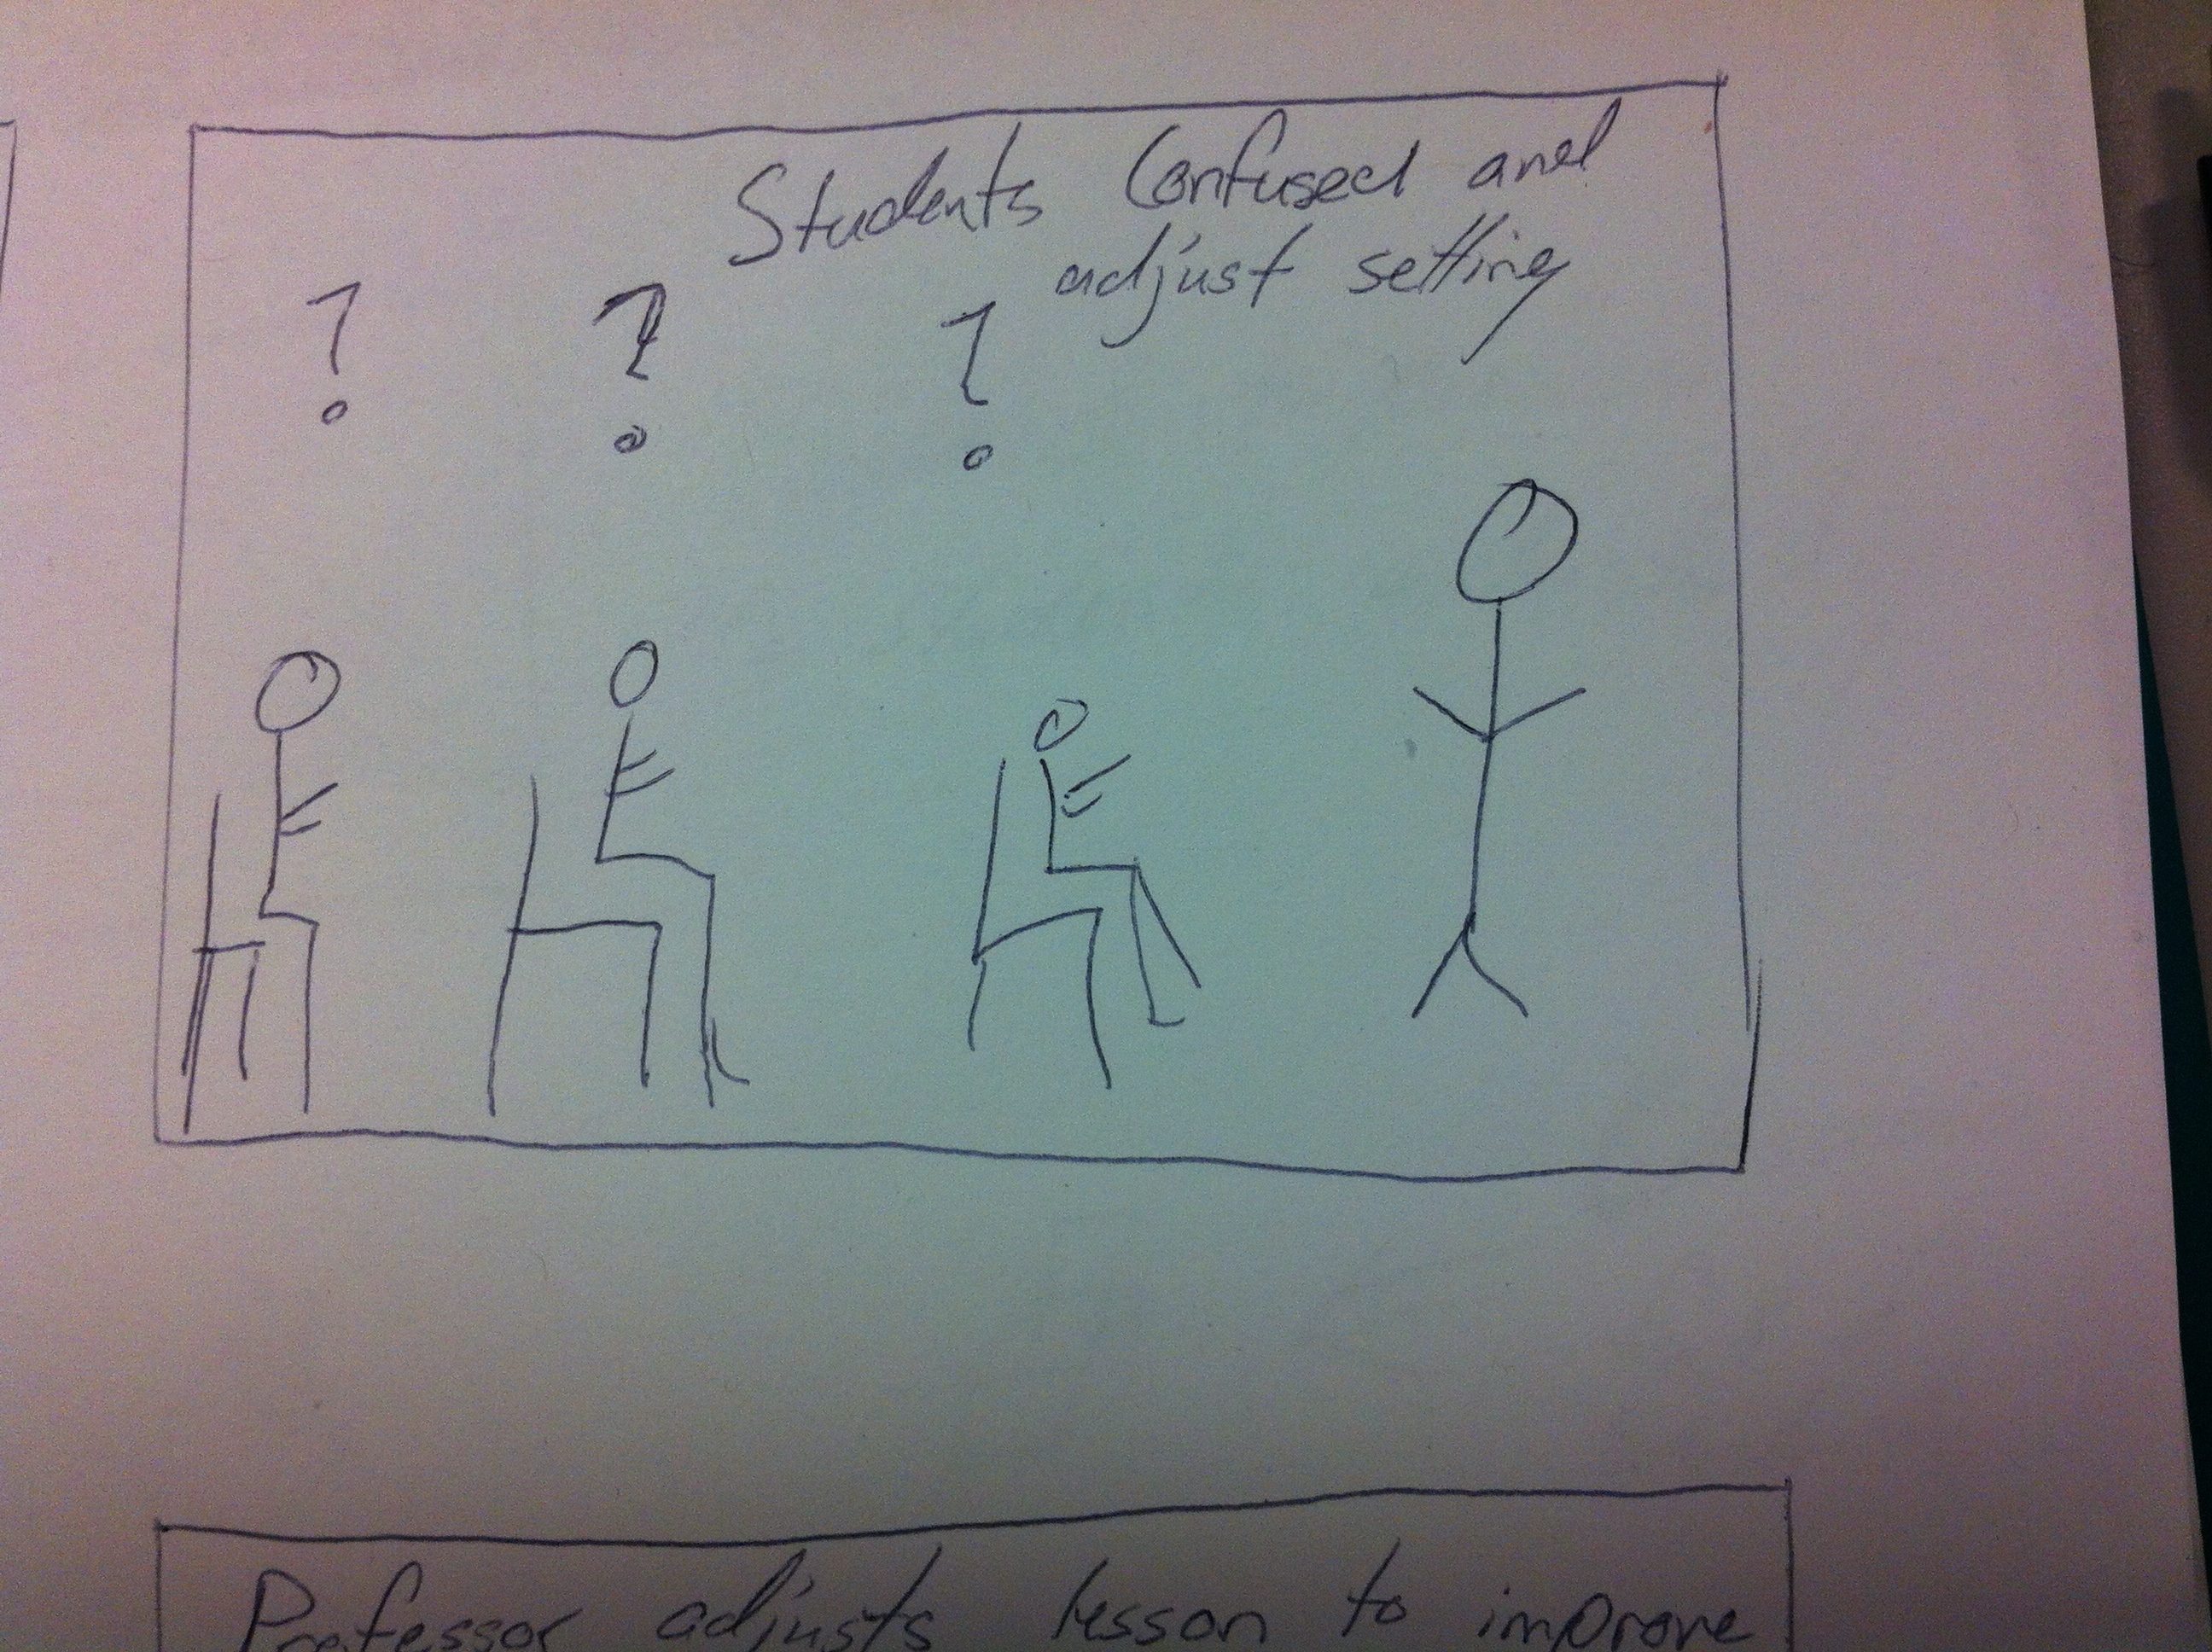
We made these changes after watching the testers use our code.

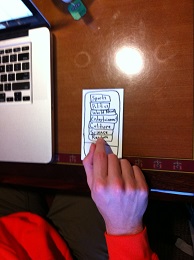
  • Debugged some of the assembly code.

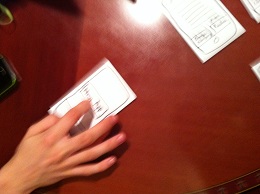
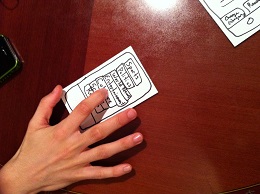
  • There is application persistence – walking in front of a tag does not cause the application to restart.

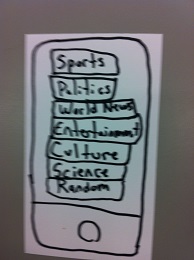
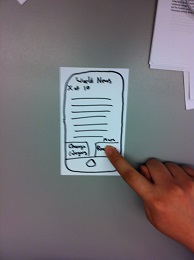
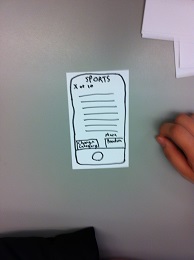
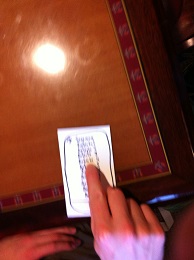
  • Write on the back of the tags what it says on the front so that users can easily pick up tags that they need.

We made these changes based on the suggestions of the users.

  • We added debugging messages to the “Assembly” program to provide feedback when a user creates a compile or runtime error.  Before we just highlighted rows.

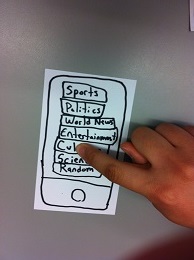
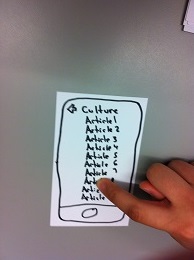
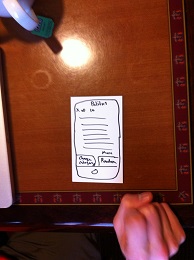
  • Clean up the numbers display so that decimal, binary, and hexadecimal have sections.

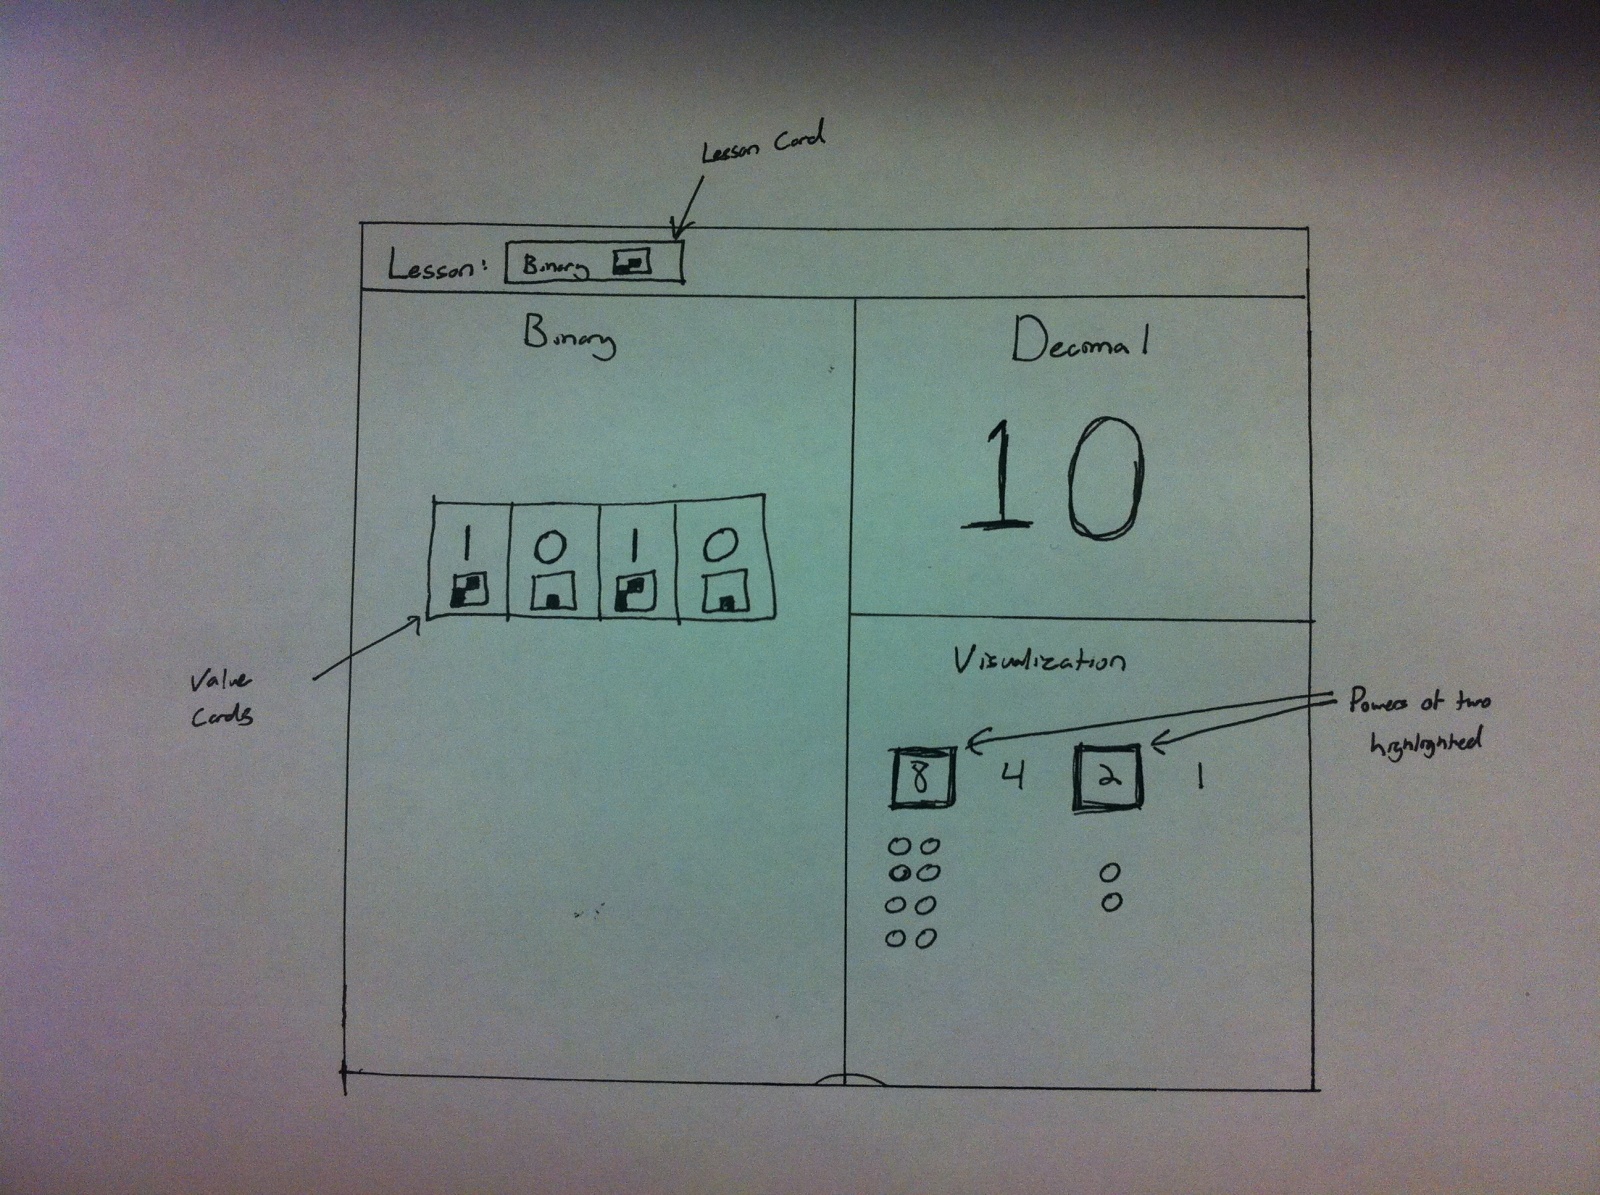
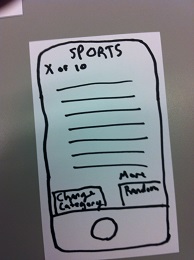
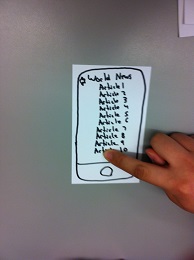
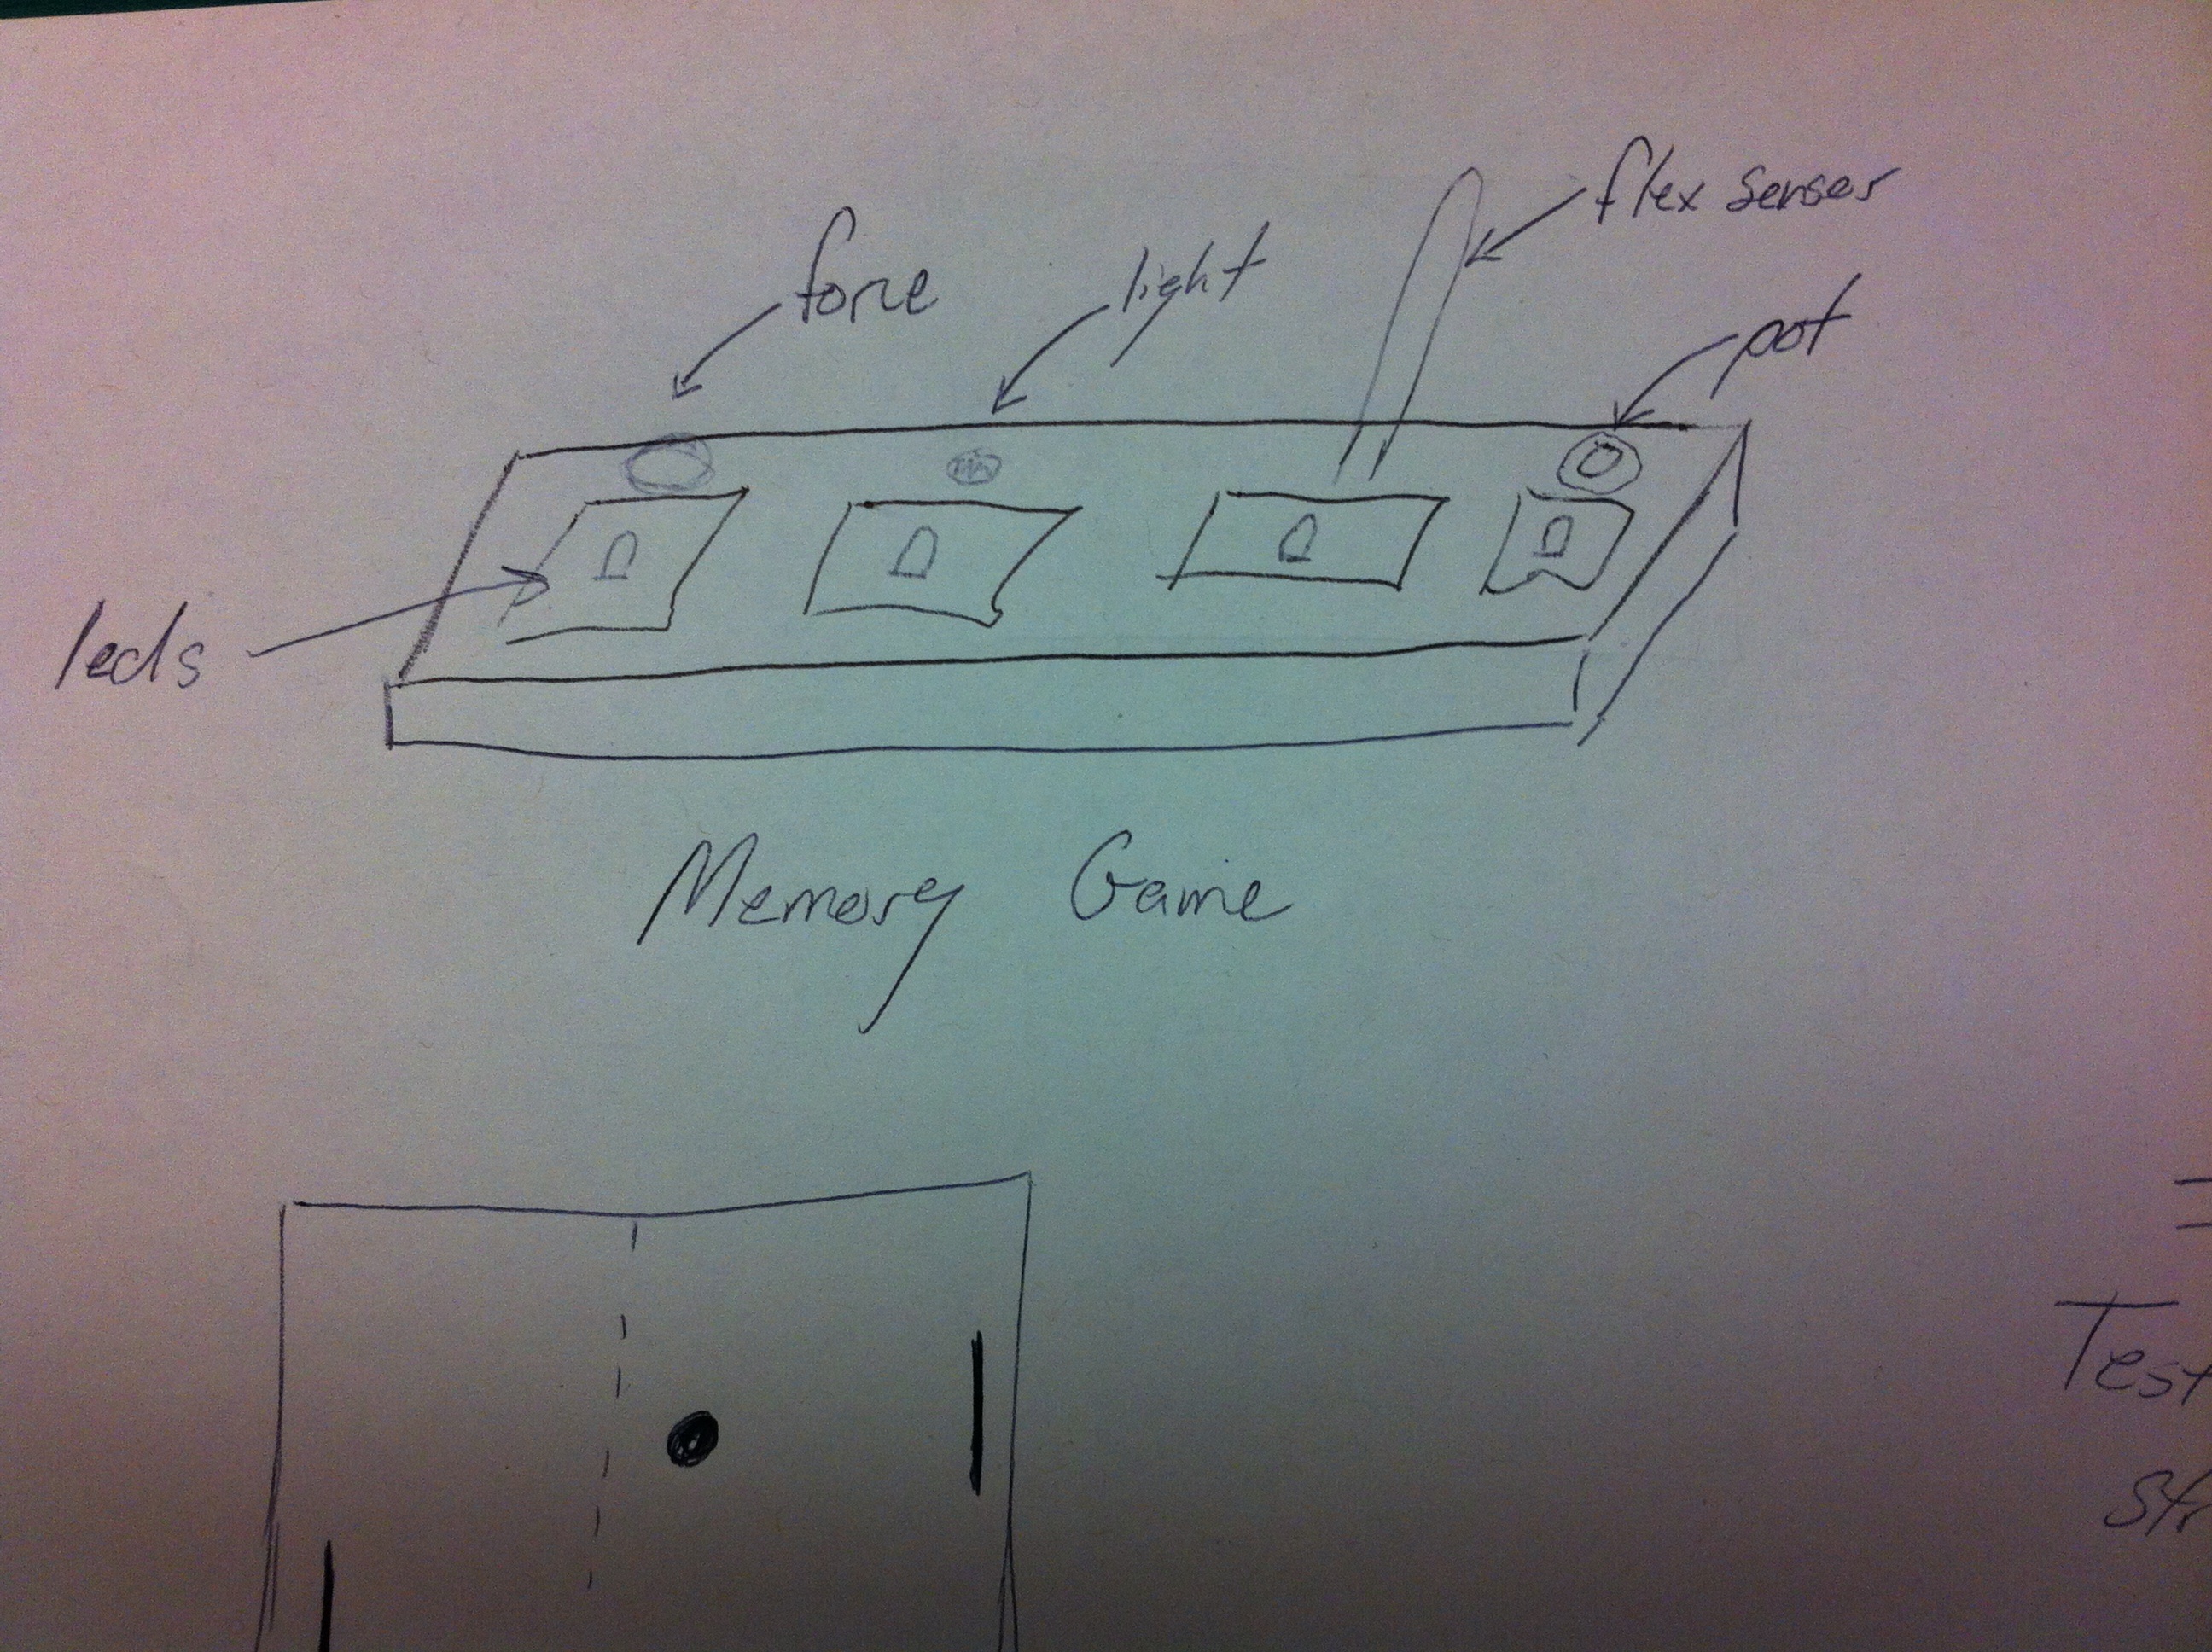
  • The “Numbers” program shows how the numbers are generated.

  • Initialization does not require users to cover up tags.

Evolution of the Goals/Design (1-2 Paragraphs):

Goals

Our idea began with the a problem: students in America are not learning enough about Computer Science.  The goal that we set during P1 was to create a technology that helped facilitate CS education to students of all ages.  The first step we took toward that goal was to refine it further.  At first we were thinking about how we could make learning CS more engaging.  We toyed with games and other teaching tools.  Ultimately, however, we decided that we wanted our goal to be to make a lightweight, relatively inexpensive teaching tool that could be used by teachers to engage students in the classroom and provide students with a tactile interaction with the concepts they are learning.

Design

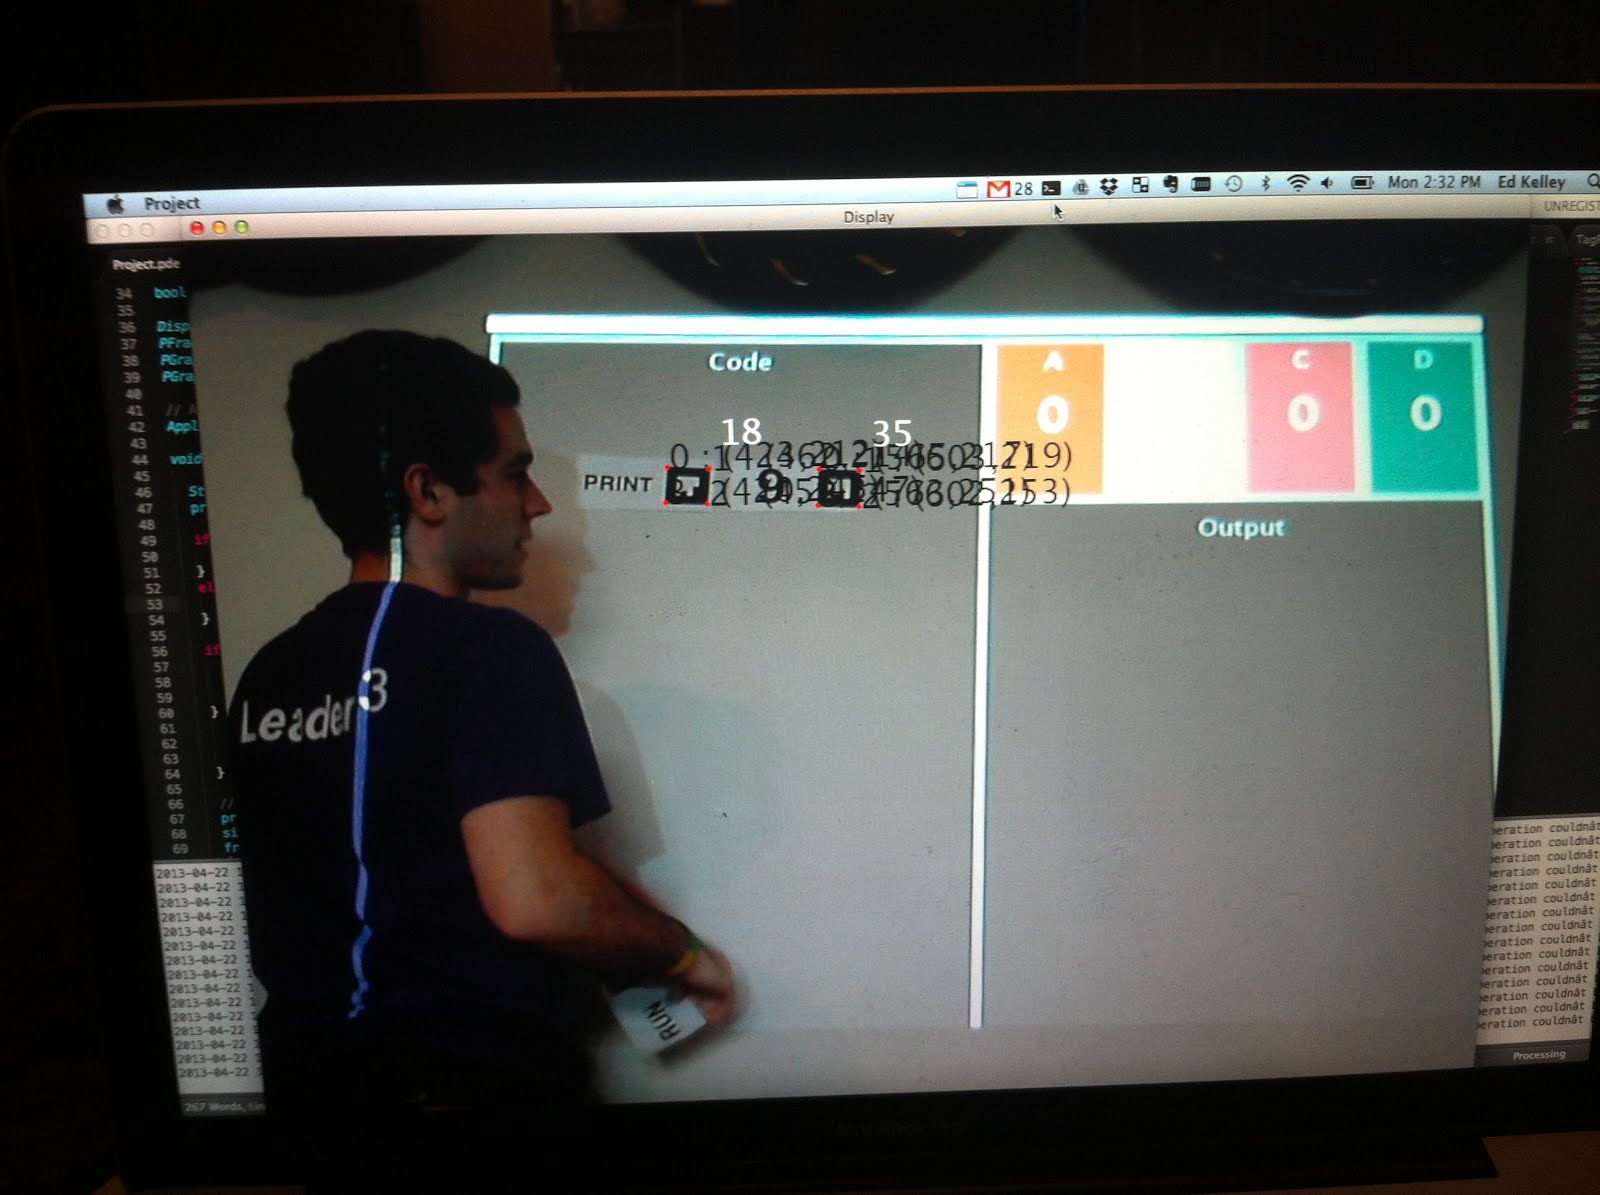
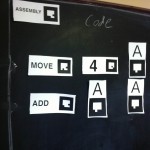
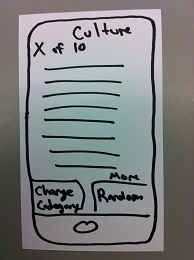
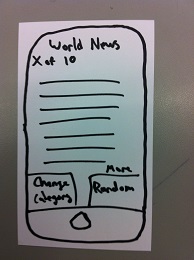
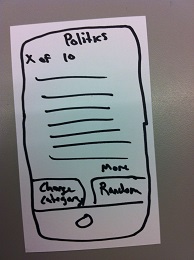
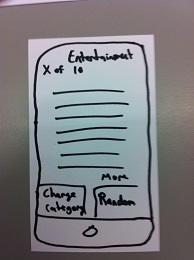
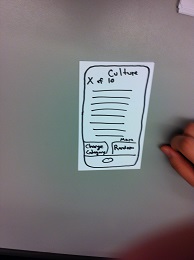
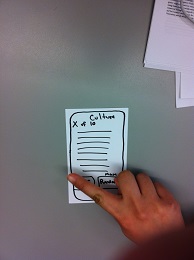
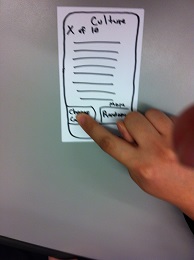
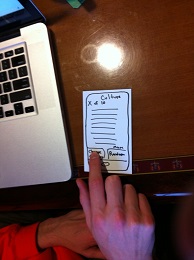
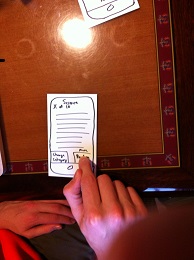
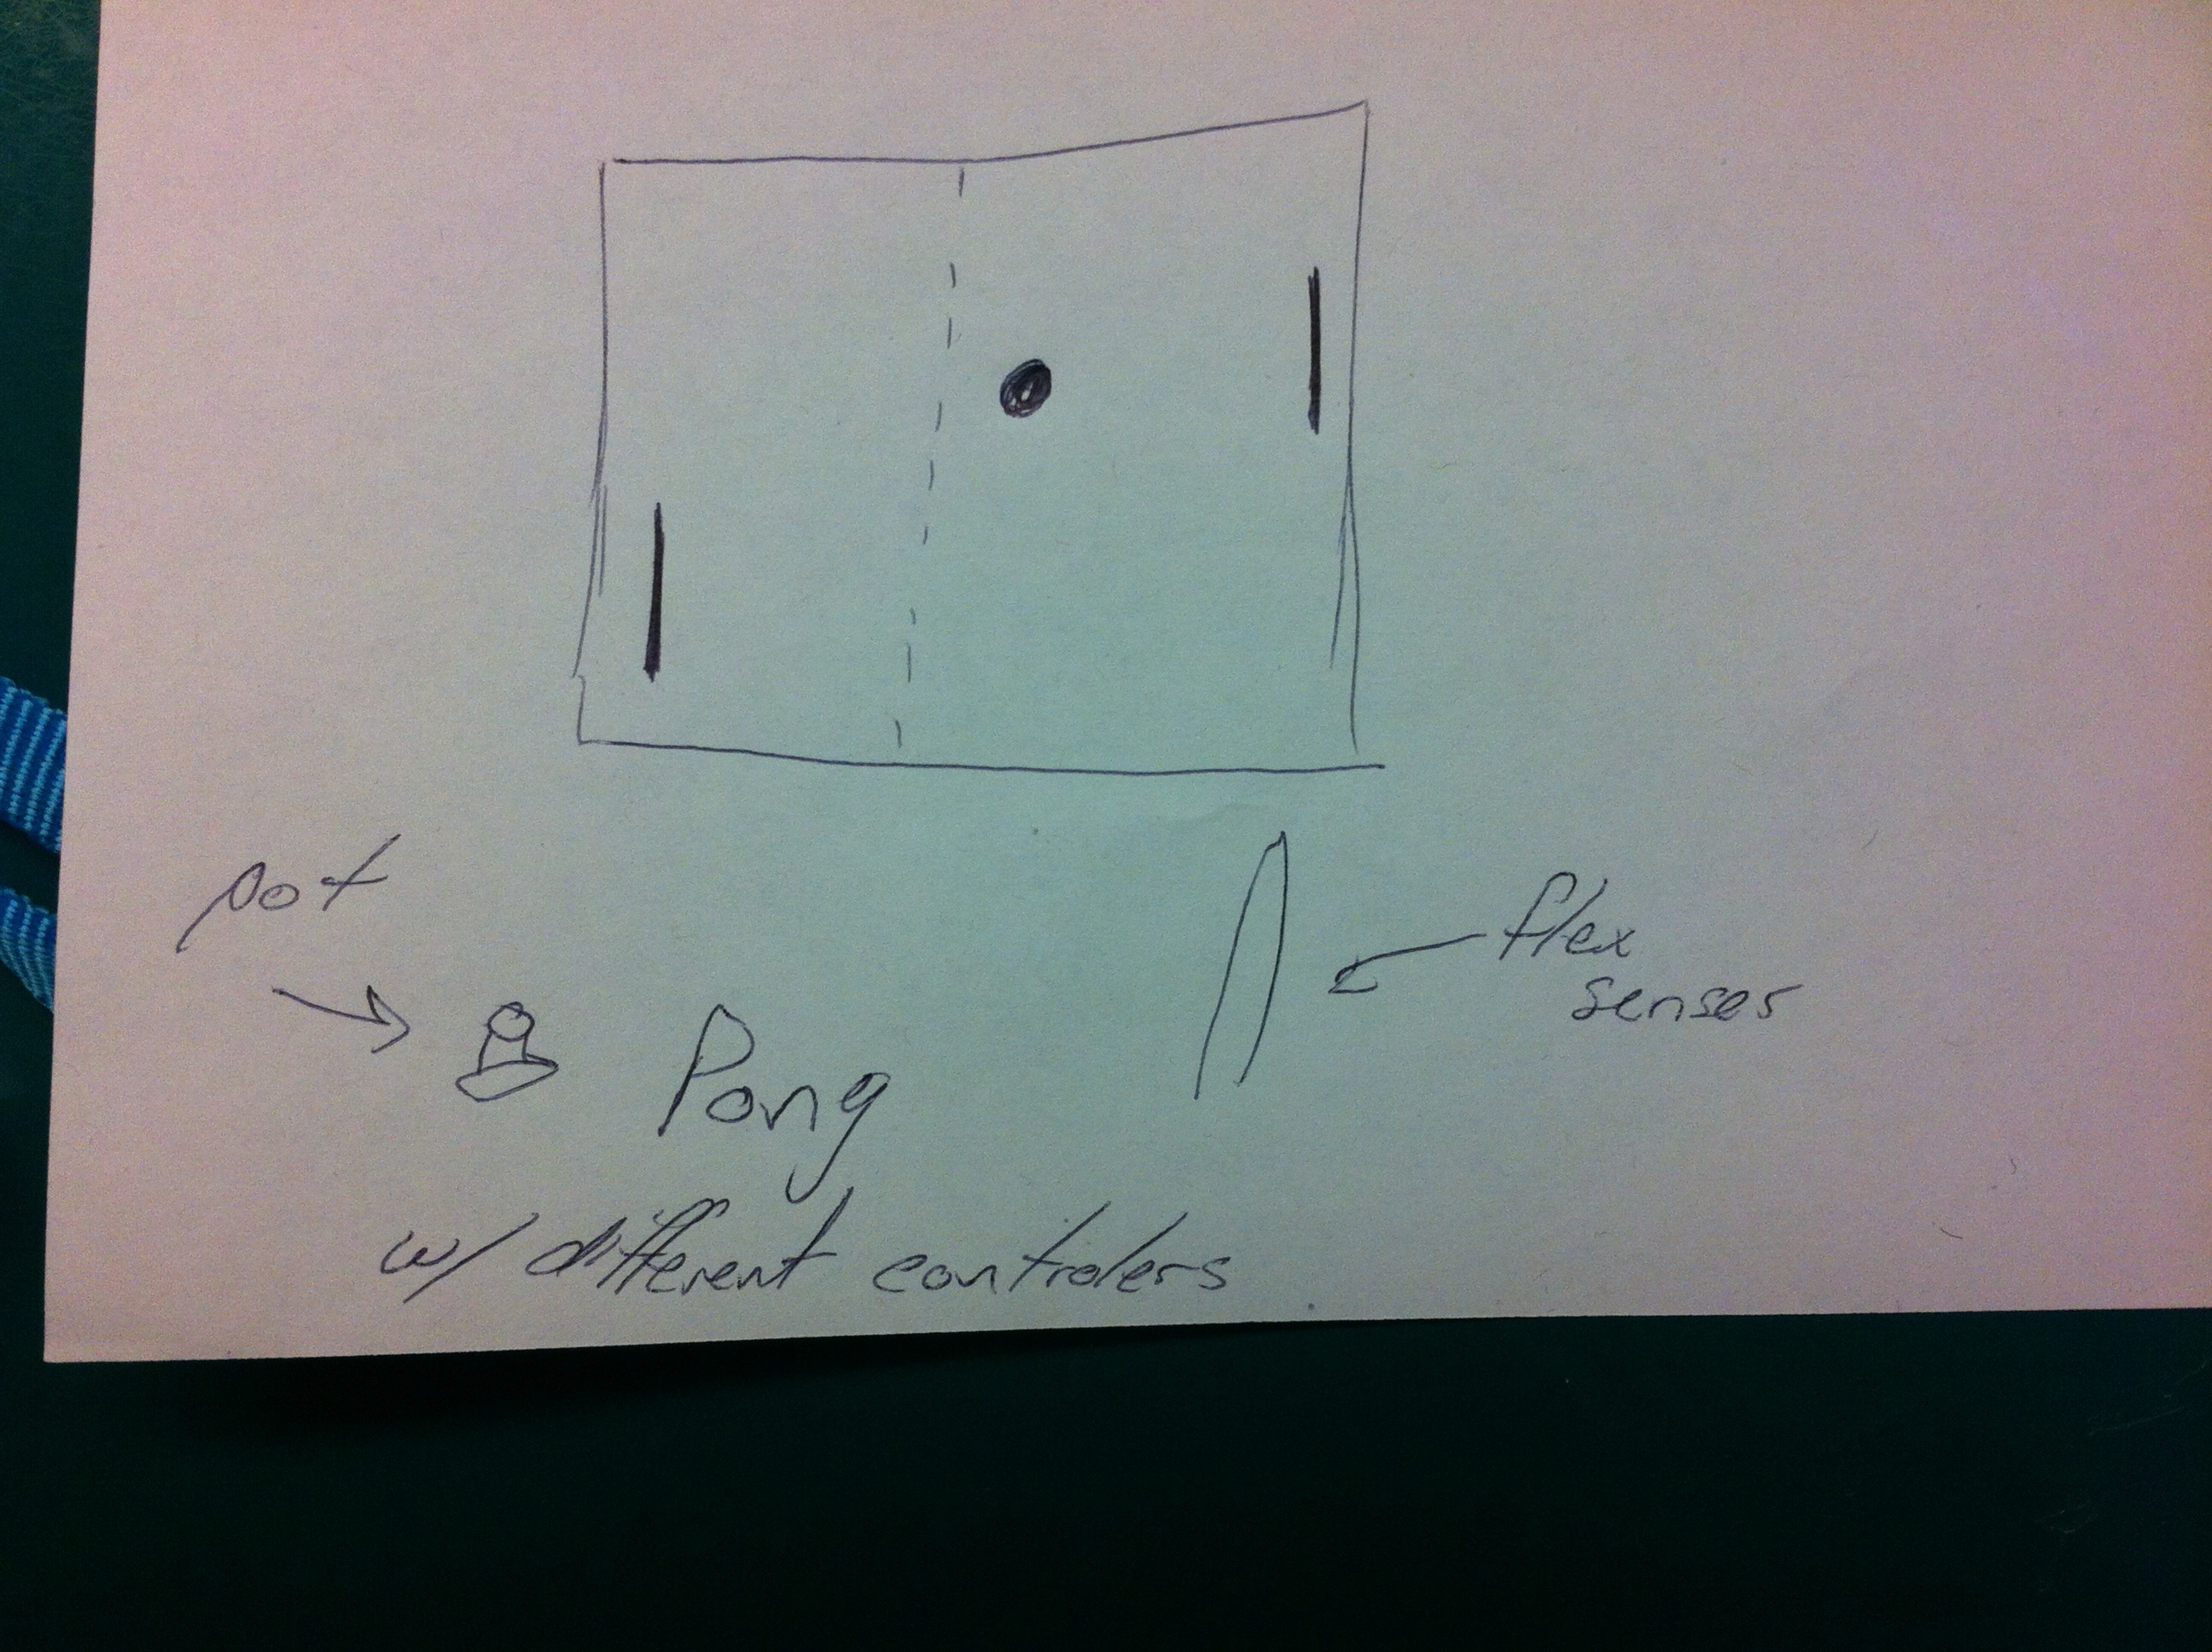
With this goal in mind, we set out on the process of design.  We immediately took up the technology of AR tags.  We really liked the fact that you could print them out for essentially pennies and make new lessons really cheaply.  We also liked the idea the teachers could throw together this tool from technology they might already have floating around a classroom (i.e. an old webcam or projector).  Again the process of design, like the process of goal making above was about specificity.  Once we have the basic design of AR Tags, we delved deeper into how this design will actually look.  We created metaphors such as “Tag Rows” where our system identifies horizontal rows of tags automatically.  We played with various types of user feedback.  Displaying lines and debug messages on top of the tags.

HCI as a Platform

Moving beyond the scope of the required sections of our projects, I think that one of the areas where we went above and beyond is not only creating a stellar interface but actually creating a usable platform for interface development.  We created sandboxes, metaphors, and ways that developers could safely create applications on our platform quickly.  We expose data structures (like the Tag Library) that allows our development users a myriad of options for accessing the data on the page.  Although clearly not as advanced or fleshed out, our platform is akin to the iOS platform which allows applications to take the complicated problems of capacitive touch and exposes them as simple events for developers.  In the process of making this platform we have learned a lot about the possibilities of our project.

Critical Evaluation of the Project (2-3 Paragraphs):

After working on this project for a few months, a future iteration of this project could be turned into a useful real-world system.  There is certainly a need for teaching computer science to people, particularly young students.  Very few middle schools teach computer science since they do not have the resources or the teacher training.  Many middle schools cannot afford to have computers for every students or even multiple computers per classrooms.  These schools do usually have one projector per classroom and one laptop for the teacher.  Our project combines the projector, the laptop, and a $30 webcam and would allow schools to teach computer science without expensive hardware and/or software.  There is certainly a need for computer science instruction, and a future iteration of our project could certainly help eliminate some of the obstacles that currently prevent the teaching of computer science.

We made our program modular so that future users could develop programs to teach what they wanted.  Just as the we created the “Numbers” program and the “Assembly” program, a teacher could create another program very easily.  All they would have to do is create a few tags corresponding to their lesson and some source code that would interpret the tags as needed.  Our program could provide them with a list of tags rows and a graphic.  They could change the graphic with their program and parse the tag rows to create a reasonable image.  If people ever used our program in the real world, they could easily customize the interfaces we provided to suit their needs.  Thus, although we only created a few lessons, other users could create many lessons to teach multiple topics.

Even outside of the classroom, there is a great need for computer scientists and people who know how to program.  Some of these people have taken some computer science courses in college but want to further their knowledge and understanding of the subject.  Many of our testers varied in their backgrounds in computer science.  However, they all were able to learn and practice by using our system.  By creating this project and interviewing and testing potential users, we have learned a lot about the difficulties of computer science and the topics that students find most difficult.  We geared our project towards teaching these topics better.  We did this by creating a binary program and by creating a TOY program which very easily shows memory management with the registers.  Thus, with our interviews and tests, we learned a great deal about the trouble with learning computer science and geared our project towards teaching those concepts.


Moving forward with the Project (1-2 Paragraphs):

Looking ahead, there are many ways we could improve our project design and develop it into a fully functional retail product. Currently our project is still a basic proof of concept, demonstrating its capabilities as a useful teaching tools. Keeping in mind our initial goal to develop an interface that would be used in a classroom environment by both teachers and students, our primary focus in developing our project further would be to improve the interface, make more built in lessons, and develop a platform for teachers to easily create new lessons.

In addition to making the overall presentation cleaner and more professional looking, the interface improvements would primarily be graphical additions such as animations and indicators that communicate to the user what is currently happening as they interact with the system. These improvements would not only make the system more intuitive, but also more entertaining for students. Additional useful features we could add may be things such as voice overs of instructions and demonstration videos on how to use various features of the system.

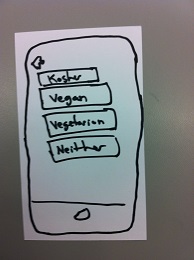
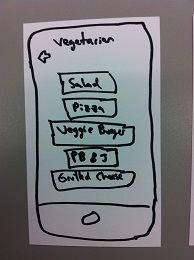
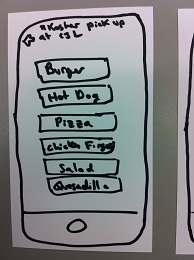
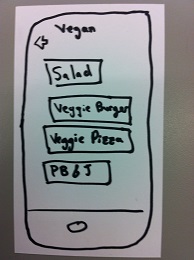
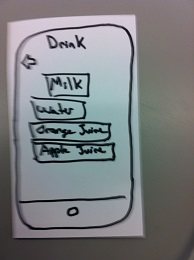
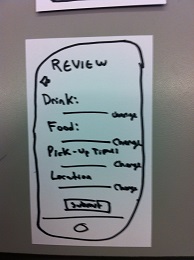
One of the most important things we would like to improve is the library of built in lessons available for users to chose from. Currently we only have two basic lesson: base-conversion and a TOY-programming environment. A more developed lesson library may contain tasks involving more advanced programming topics, teaching various programming languages, or even educational games. There would also be no need for lesson topics to be restricted to CS related topics. Our system could be effectively used to teach virtually any subject provided the right lessons are created.

Another key improvement we would like to make is developing a lesson creation environment where teachers can quickly and easily design their own lessons for their students. Any lesson library we make on are our will inevitably be lacking in some aspect. Giving users the power to create their own lessons and even share them online with each other will vastly improve the potential of our system as a teaching tool.

Our code base can be found at: https://docs.google.com/file/d/0B9H9YRZVb0bMY2JCZzhPa19ZZE0/edit?usp=sharing

Our README can be found at: https://docs.google.com/file/d/0B9H9YRZVb0bMNlllTElqdHdBYnc/edit?usp=sharing

Bulleted list of Third Party Code (including libraries):

  • Homography

  • Used to calculate transformation between camera coordinates and projector coordinates


Our Poster:

https://docs.google.com/file/d/0B9H9YRZVb0bMb2NvbUFhZWZ6VTA/edit?usp=sharing

Additional Demo Print Outs:

https://docs.google.com/file/d/0B9H9YRZVb0bMS2pxZmQ1cjJZSTg/edit?usp=sharing

P6 – Name Redacted

Group 20 — Name Redacted

Brian, Ed, Matt, and Josh

Sum­mary: Our group is cre­at­ing an inter­ac­tive and fun way for mid­dle school stu­dents to learn the fun­da­men­tals of com­puter sci­ence with­out the need for expen­sive soft­ware and/or hardware.

Introduction: The purpose of our system is to introduce students to the basic concepts and principles of computer science and to teach them in a fun, intuitive, and interactive way. The purpose of this experiment is to gauge various aspects of our system such as intuitiveness, ease of use, and difficulty, and to ascertain any changes we could make that would improve the user’s overall experience.  In particular, we want to see how easy or hard each of the three tasks are and whether or not the tasks were intuitive.  Our bigger concern is that the tasks are not intuitive.  Every student of computer science will think that different topics are of varying difficulties, but if our system is not intuitive, no study will be able to learn from it.


Implementation and Improvements:

  • Since P5, we created a better debugging mechanism and initialization feature, which we have now made into our easy task.

  • There are no wizard-of-oz techniques in P6 whereas there were those techniques in P5.

  • The TOY Program has a compilation phase and a running phase to allow jumps to future labels.  The user does not notice the difference between the two phases to provide a better level of abstraction.

  • The TOY Program goes line by line waiting 1.5 seconds during execution so the users can see how the registers, etc. change.

  • The TOY Program has error messages where there is either a runtime or compile time error.

http://blogs.princeton.edu/humancomputerinterface/2013/04/22/p5-name-redacted/


Method:

Participants: Our participants were all Princeton University students with varying degrees of computer science backgrounds, ranging from no background to only two introductory courses.  We chose these participants because they did not have a lot of computer science background, and our target audience are people who are trying to learn computer science but do not have much formal training.  The participants ages ranged from 19 to 22.  One came with an engineering background, one with a social science, and one with an anthropology background.  All three participants were male and each had some prior level of teaching experience.  When choosing participants, we wanted students who also had taught, so that we could simultaneously test both groups in our market.  With only three participants, we really did not have a lot of opportunity to create a diverse group of participants.


Apparatus: Our project uses paper tags with the corresponding text labels, a projector, a webcam and a laptop.  In a school, the projector will already be connected and set up to a laptop, so we set that up for the testers.  We asked the users to connect the webcam and then follow the initialization instructions so that the program can map the webcam coordinates to the projector coordinates.  The paper tags already had tape on the back of them so that the users could easily put the tags onto the wall.  We conducted the test in an eating club since there was a space about as large as a classroom that allowed us to project on a large open wall.


Tasks:

Program Initialization (EASY):  This task is the initialization of the program that requires the users to initialize the webcam and projector space.  This task also includes key commands that allow the users to debug their own code, by showing them which lines are grouped together as rows.  Part of the idea from the task came from an expansion of the Tutorial feedback, since the tutorial should really begin when the program is first loaded on the teachers laptop and be geared towards helping users debug their programs.


Numbers (MEDIUM): In this task, users will be introduced to number systems and learn how to convert between them. Users will be able to make numbers in binary, hexadecimal, octal, or decimal and see the number converted in real time into the other number systems.

TOY Program (HARD): In the TOY programming environment, users (primarily students) will be free to make and experiment with their own programs. Users create programs by placing instruction tags in the correct position and sequence on the whiteboard. The program can then be run, executing instructions in sequence and providing visual feedback to users to help them understand exactly what each instruction does.

Task Selection: We chose the “Program Initialization” task because it is the first step in using our system and every user would have to complete this task. Once this step is completed, it makes sense to have the user try out each of the applications we developed for the platform.

Procedure: We made sure each participant consented to the study with knowledge that their image and or video with them may be published on a blog post on the publicly searchable web.  With each participant we introduced them to the goals of the project as stated in a previous section of this write up.  We then gave the participants a high level introduction into the system, explaining how the tags are used as well as what the tasks entail.  We introduced the participant into each task and asked them to perform the task.  We offered the participants a post-survey questionnaire which is in the Appendices section  of this write up.

Test Measures: We asked the participants to fill out a questionnaire that asked them to rate our program on a scale from 1 to 5 on several different aspects.  These aspects were Overall Ease of Use, Overall Intuitiveness, Initialization: Difficulty of Task, Assembly: Difficulty of Task, and Numbers: Difficulty of Task.  We also analyzed how users interacted with the program by taking less quantitative measurements about how much it seemed that they struggled with a given task, or how easy a task was, etc.

Documentation:

Each tag has a unique visual marker.

Participant 1 Using “Numbers” Program


Participant 2 Performing the Initialization Task


TOY Program


Results and Discussion:

Measure

Average Rating (out of 5)

Overall Ease of Use

4.66

Overall Intuitiveness

4.33

Initialization: Difficulty of Task

4.66

Assembly: Difficulty of Task

4.33

Numbers: Difficulty of Task

4.00

Overall we felt that the tests were rather successful in not only reinforcing the feedback that we had received in previous iterations of the prototype but also in showing us how to further improve our system.  To start, the feedback was extremely positive.  We received an overall average “Ease of Use” rating on our anonymous survey of a 4.66 out of 5.  On the “Intuitiveness” of our system, we received an overall average rating of 4.33 out of 5.  Both of these numbers were high both for users of moderate and limited CS background.  This tells us that we were able to provide users with an interesting an intuitive educational experience despite the fact that they had very limited training and knowledge of CS concepts.  Users had very positive verbal feedback.  One of the users who had no computer science background even remarked upon the “theme of rows” that seemed to be going across our different applications. This was really interesting because horizontal tag rows is a fundamental metaphor built into the system and it is something that someone could pick up without seeing a line of code.  Of the three tasks, it was clear both from their self reported values and from observing the users that the “Numbers” task was clearly the most confusing. They primarily seemed to take issue with the location of where numbers were displayed in relation to the ID tags placed on the board. We will focus more energy on cleaning up that task and making it more visually intuitive and appealing.


Going forward from the positive information given, much of the constructive criticism that we received centered around the depth of the product.  Our users seemed to grasp the fundamentals of putting tags on the wall.  Our users even started to develop different user patterns.  One user, for example, would constantly “compile” his assembly code to check for errors while most just wrote the program and compiled once at the end.  The place where they struggled was with the tasks being too “abstract.”  This idea of abstractness has been on our minds since our first contextual inquiry when it was suggested to us.  Users wanted to know “how the initialization step worked.”  They wanted more information about the conversion process from binary to hex.


Jumping off from comments like these, we have ideas of specific changes we want to make to the system to help increase its connection with the users.  We are going to change the number system a little so that we display exactly how the numbers are generated (2^0 + 2^1 + 2^3 = 11).  We are going to include more documentation for each of the three tasks.  It was a little confusing where to put the base tags for the numbers method.  We may create rows for the number method so that the user knows where to put the hexadecimal, decimal, and binary tags.  It was also unclear that the base numbers had to be to the far left of each row, so that would be included in the documentation.  Similarly, the testers asked what the arguments for various commands were and this needs to be cleared up in the documentation about the program.  All of these specifics boil down to two main themes.  We need to cater the UI to make visual suggestions to the user as to what they should do next (i.e. how many arguments does print take with visual boxes).  We, also need to increase the visual documentation so that the user can ask the questions about what’s going on “behind the curtain.”


We are also working on tag persistence.  Users don’t understand that if they walk in front of the camera, they block it’s field of view so we want to make the camera less vulnerable to view blocking but having it remember tags for a few seconds.  We also learned a few things about the space that our project needs to be in to work.  The sunlight was causing problems for the camera since the black and white tags were not being picked up by the software.  We needed to move the projector closer to the wall, which created a smaller output image.  The code section for the TOY Program was a little small for fitting three tags on one row


Appendices:

Consent form – Updated from P4:

https://docs.google.com/document/d/17J1J9EMwjDzunhS-5s4-L517EtXTwkqsPd7rr3VfHc


Interface Feedback and Demographic form –

https://docs.google.com/forms/d/1xOa9_gey2mPCII_JeCPdjFmfMKsI_x2r1eScCl1P2Es/viewform

https://docs.google.com/a/princeton.edu/forms/d/1xOa9_gey2mPCII_JeCPdjFmfMKsI_x2r1eScCl1P2Es/edit

The demographics are on the second page of the form.


P5 – Name Redacted

Group 20 – Name Redacted

Brian, Ed, Matt, and Josh

Summary: Our group is creating an interactive and fun way for middle school students to learn the fundamentals of computer science without the need for expensive software and/or hardware.

Description of the tasks:

Binary: In this task, users will be introduced to number systems and learn how to convert between them. Users will be able to make numbers in binary, hexadecimal, octal, or decimal and see the number converted in real time into the other number systems.  The program will shows the users how the octal, hexadecimal, and binary numbers are created (i.e. 2^0 * 1 + 2^1 * 1 = 3).

Tutorial: In order to introduce teacher to the basic of the TOY programming interface, they will be guided through a basic tutorial teaching them how to use the features of the system while making a simple program. Users will be guided through the process via on screen text, drawings, and animations that will explain what the onscreen information means, what to do next, and how to interact with the system.

TOY Program: In the TOY programming environment, users (primarily students) will be free to make and experiment with their own programs. Users create programs by placing instruction tags in the correct position and sequence on the whiteboard. The program can then be run, executing instructions in sequence and providing visual feedback to users to help them understand exactly what each instruction does.

Program Initialization: There is also a fourth task that we have created while developing our working prototype.  This task is the initialization of the program that requires the users to initialize the webcam and projector space.  This task also includes key commands that allow the users to debug their own code, by showing them which lines are grouped together as rows.  Part of the idea from the task came from an expansion of the Tutorial feedback, since the tutorial should really begin when the program is first loaded on the teachers laptop.

Choice of the tasks:

We decided not to change our tasks significantly from P4 to P5.  Starting with P2, we received feedback from students and an instructor suggesting that binary and visualizing memory were the two hard (and very important) concepts when first learning computer science.  There was a general consensus that binary was easier than visualizing memory and coding in TOY.  Thus, we really want our tasks to include these two concepts from computer science.  Our third task is focused on the teachers who will use our project.  This is a logical last task since our user group is both students and teachers.  Teachers will need to learn TOY before teaching their students, and thus we need to provide a simple interface to teach them the main concepts in the TOY language.  We also cannot assume that every teacher will have an advanced computer science background, so the tutorial has to be simple enough and yet still explain the details of TOY.  However, we created a fourth task given the feedback from P4 and the information gained while building the prototype.  We are going to provide a simple interface for teachers to learn how to initialize our system.  This is very simple, and just requires the teacher to push “i” to map the webcam space to the projector space, but is still very important nonetheless.  It will also require telling the teacher how to put tags on the board to switch between TOY Programming, the tutorial, and binary.

Revised Interface Design:

The big push of our work this week was to try and fit the design aspiration of the projects to the realities of the technologies.  At the core of our project is a fundamental platform we created that allows developers to write applications on top of it.  Before talking about the specific applications that we implemented, I want to touch on the design choices that we had to make for the platform itself.  These are design choices that we couldn’t have conceived of while doing the paper prototype because the reality of the technology did not exist.  Our fundamental platform interface is this: Users boot the program on a computer attached to a monitor.  Two visualizations are rendered on the screen.  The first is the projector space.  This is where applications can write.  The second is the monitor space.  This is where the camera image is displayed.  The camera is then pointed at the projector and the “i” key is pressed.  This starts our “initialization mode,” where we align the projector coordinates with the camera coordinates and calculate the appropriate translation.  After the system has been initialized, you can then press the “u” key to display debug information on the projector.  When tags are placed on the screen, their corners are highlighted by the projector showing that it is properly aligned.  Also, when tags are organized into rows, those rows are highlighted to show that they tags are semantically connected.  The debugging information is a UI that we expose to Applications developers so they can see visually, how the framework is interpreting the images on the screen.

Moving on to some of our applications, the first application that we implemented is assembly.  We stuck with the same general layout as our paper prototype.  We had iterated through where we were going to place the “code,” “output,” and “registers” sections previous to the final paper prototype.  Given the feedback that we received during prototype testing, we felt that this final layout (code on the left, registers and output on the right) was the most effective.  We did play around with various output types.  This is again something that didn’t come up as much during the paper prototyping phase.  Now output needs to scroll.  We also dealt with the clearing of the output field when programs were re-launched because that was something that our testers had found confusing.

Our second application that we implemented with our number base conversion application (We call it “Binary”).  This is where the user can see how different number representations might display the same numerical value.  Our paper prototype was very free-form and allowed for users to place the tags anywhere on the board.  This lead to confusion, where users would either place too many tags on the board or place tags in the same row when they did not mean to.  We therefore altered our design so it was more constructive.  We created a grid that the users could populate with values.  This suggests to them that they need to separate the rows spatially and also helps them to understand that they should only fill in a single field at a time.

Moving forward, we have a couple of interesting features we have yet to implement.  I think the biggest place where UI design will have to play a role is error messaging.  With the complexity of our Assembly application, we saw that users are already prone to creating erroneous and nonsensical programs.  This is not a problem with our application.  Some of the greatest “teachable moments” in computer science come not out of writing correct programs but realizing why a given program is incorrect.  We therefore want to make sure that the user gets the most informative UI possible when an error is received.  This will include syntax highlighting and visual feedback.  We have created a few sketches of possible designs in the slideshow below.

This slideshow requires JavaScript.

Overview and Discussion of Prototype:

i) Implemented Functionality

Our  project can read in the AR Tags with a webcam, and apply the correct homography translations to map the webcam space to the projector space.  This allows us to circle tags with the projector that are on the wall.  We used this functionality to create our debugging API which allowed us to get the extensive backend code fully operating.  Our debugging API also gave us greater insight into the limitations of AR Tags.  Namely, AR Tags on a screen must be unique.  There are 1024 different possible AR Tag combinations, and so we are in the process of creating multiple tags for register names, TOY labels, and integer literals.  We also have a TOY to Java compiler and interpreter that allows any sequence of the commands to be read and executed.  The debugging API that we have been using for development will evolve into a debugging API for the students using the program, where incorrect syntax will be highlighted and errors shown on the output side.  The big hurdles when creating the backend and preliminary front end interfaces were getting familiar with Processing, determining the limitations of Processing and AR Tags, and creating a suitable abstraction that will allow for easy proliferation of tasks.  We have created a very simple abstraction that would allow programmers to easily create new applications, as well as allow us to create new applications.  No matter what the frontend application, we have created an interface that the backend can interact with, so that a new application would require no new backend programming.  Overall, both the frontend and backend code together are more than 1300 lines of code, almost all of which we wrote (tutorials borrowed from listed below).  We wanted to talk extensively about the backend functionality because it required a lot of work and hours, but it enabled us to create an interface that will make finishing the project much simpler.  Although the frontend programming is not completely done (and most of the “wow” factor comes from the frontend features), the backend is certainly the hardest part of the assignment and it is nearly complete for the project.  The TOY Program is also nearly complete, and the binary program should not take much more time given the interfaces and abstractions that we created.  The Tutorial is just an extension of the TOY Program.

ii) Left Out Functionality

We decided to leave out the error messages that the TOY Program generates for a few reasons.  Firstly, all of the code is there to implement the feature, but we are currently focusing on our debugging and thus we have made the output images projected help us rather than a potential future user.  However, the red boxes seen in the images in the next section are essentially the same as the error messages that users will see in the final product, but for now we were more concerned with debugging the back end and extensive tag libraries that we had to write.  In a similar fashion, we left out some of the messages that will appear during the tutorial, but the messages will appear in the output section of the TOY Program, which is already set up to print the desired tutorial messages.  In the meantime, however, we wanted to use this section for our own debugging purposes.  Now that we have basically finished the backend, we can start specializing these parts of the code to focus on the user.  The functionality that we decided to leave out is very easy to add, but for the time it is more important to create a debugging framework.

iii) Wizard-of-Oz Techniques

There are no wizard-of-oz techniques for the TOY Program.  However, the output for the binary program is hard coded in for now, while we further develop that individual program.  We are also going to accept the advice of our paper prototype testers and put more information about how we calculate the binary output.  Also, at the time we only have one tag corresponding to each command and number.  By the final prototype we are going to have multiple tags for each command and number so that the programs can be more complete.  We only have one tag corresponding to each number since it took so much coding on the backend and the debugging API to be completed before realizing that limitation of the AR Tag library.  We decided to have the output for binary hard coded in for now since we wanted to really finalize the backend of the application with a layer of abstraction that would make coding the rest of the binary program very easy.  Thus, we decided to focus much more on getting the backend complete than on the frontend applications.  This makes sense, since the frontend could not run without the backend basically completed.

v) Documented Code

For the AR tag detection, we are using the NyARToolkit, a Java implementation of the ARTooKit Library, available at http://nyatla.jp/nyartoolkit/wp/. For calculating homography, we are using the homography library created by Anis Zaman Keith O’Hara, available at https://code.google.com/p/the-imp/source/browse/src/PCLT/src/edu/bard/drab/PCLT/Homography.java?r=7a9657a65e976ac38b748b35fa7b36806326011d. We used a Processing and ARToolKit tutorial to get started, but only small elements of this tutorial remain in our current code. This tutorial is available at http://www.magicandlove.com/blog/research/simple-artoolkit-library-for-processing/.

Documentation


Testing setup.


Toy Program. The red boxes are for debugging, showing that the homography is working and the tags are correctly identified. The output correctly shows the results of the program (which has been run multiple times).


Monitor display. Shows tag debugging information and camera view.


Testing system on a projector screen.


Example of the Binary program. Currently hard-coded values used. However, building the application in our framework will be a relatively simple task.


P4 – Name Redacted

Group 20 – Name Redacted

Brian, Matt, Ed, and Josh

Project Summary: Our goal is to teach students the fundamentals of computer science without the need for expensive and elaborate hardware or software.

Description of the Test Method:

Consent Form:

To obtain consent, we explained the three tasks to the participants.  We made sure that they understood that their participation was completely voluntary and that at any moment they could stop participating.  We asked the participants to sign a simple consent form that can be found here.

Participant Selection:

Since the user group of our project are students with limited computer science background, we got three participants who had only take introductory computer science courses.  One of our participants had taken COS 109, and the two other participants have taken COS 126 only, and are in non technical majors.  We wanted our participants to have some experience with computer science so that we would not need to teach TOY in a thirty minute block, but also not enough experience to have learned assembly language.

Testing Environment:

We tested our project in a classroom setting.  All four group members helped go through our written scripts and watched as the user interacted with our system.  We  only have one participant at a time to make the participants feel more comfortable.  We attached pieces of tape to the AR Tags so that the participants could tape the tags onto the board.  We used a blackboard to emulate a projector and we drew the output.

Testing Roles:

Matt led the discussion and task on binary, Ed led the discussion and task on the TOY Program, and Brian led the discussion and task for the tutorial.  Leading the task included saying our scripts as well as “being” the projector and drawing the appropriate output on the board.  Josh said the demo script and obtained consent from each of the participants.  He also recorded notes during the testing phase.  We all helped with the write up and discussion after the testing.  Here is a link to our demo and task scripts.

Summary  of Results:

We ran our demos with three separate users who each had little experience with computer science. Overall the demos went very smoothly, and after our introductory explanation of each task, users had little trouble interacting with our system. We also were able to get good feedback from our users on things that work well in addition to things that could be improved.

In general, users thought the interface was simple and intuitive, and they were easily able to use it after being given a brief block of instruction. In both the binary and toy program demos, users said that they would like to see feedback as to what is actually going on when the program is running or how the numbers are being converted. Some users were also confused about where exactly they were supposed to place the data cards in relation to each other. In the toy program, some users were unsure if the results of the instructions were supposed to be displayed immediately or after the run data card was put up.


Discussion of Results:

We gained some very valuable insights from testing our tasks with three different users.  Firstly, all three of the users would like a more in depth number base lesson.  All three suggested outputting how to get from binary from a decimal number (i.e. 1 + 2 + 8 = 11 for 1011).  Before these testers, we did not really consider changing the binary lesson, and we think that we can make some great improvements in the future with our binary lesson.  Looking back on our introductory CS days, these testers are absolutely correct in terms of how to think about changing numbers between different bases.  For our tutorial task, none of our testers could really provide too much insight in terms of learning how to teach students but they did like the level of detail that we provided the teacher in terms of learning about TOY.  In fact, one of the testers suggested that a similar level of detail be output when the students are coding.

Going along with this, there was some confusion about what the arguments should be for each command.  It is also a pain to write out the code for a program and then find out that the commands are all wrong.  We might be able to add a component to our program that outputs the various arguments for the six commands.  One of our testers asked if it is “mov src dest” or “mov dest src” which is not at all obvious even for computer science majors (since there are different standards).  Since we are accustomed to the intel format, we just assumed that everyone would see the command as “mov src dest”, but that is not a good assumption.

Future Test Plan:

It is time to start building the higher-fidelity prototype.  Our idea requires a significant amount of coding, computer vision, and design decisions for the output of the projector.  It is thus very important that we start creating our actual prototype if we hope to finish before Dean’s Date.  Some of the difficult design decisions will come from the coloring scheme that we use and our display of error messages.  In the future, we will test our prototype with an actual projector  and then we can get valuable feedback about how we display information.  Also, since we want our product to appeal to middle school students, it is important that our project looks nice, and we cannot provide a good visual reference for testers if we are just drawing on a whiteboard.

We have already made significant progress on reading the tags from a webcam and projecting an image.  In the next couple weeks we will show the projected images to other students to receive aesthetic feedback as well as feedback on the overall design decisions.  We will be a good place then to make these changes to the projected output.


L3 Name Redacted

Brian, Josh, Ed, Matt

Group Number: 20

Description:
Our robot has two DC motors attached to two wheels that were made from the bottoms of plastic cups. The body of the robot is supported by a plate. The robot has two light sensors that it uses to determine direction. The robot tends to move towards the light. The wires from the light sensors and DC motors are connected to an Arduino and battery pack by alligator clips. One of us carries the Arduino and battery pack around as the robot moves. We built this because we liked the idea of having the robot determine direction based on the lighting in the room. We liked that the robot was able to move towards the light correctly, although we would have liked to have made the robot more sensitive to light. If we had more resources, we would have made a sturdier frame for the robot so that the Arduino and battery pack would not have to be carried around. However, with the wheels we used, the battery pack and Arduino added too much weight and the wheels collapsed under the weight of the robot. We also really liked how the robot used two motors to propel itself, as well as moving on two wheels as opposed to four.

Brainstorming:

  1. Light seeking robot that move towards more light.
  2. Attach a weight to a motor that uses vibration to move.
  3. Two motors in the front and a pin in the back to control direction.
  4. A sail that uses a servo to control the rudder and/or direction of the sail.
  5. Motors on a boat that paddle the boat forward.
  6. Make a unidirectional segway using a motor.
  7. Make a cart that is moved by a fan and the fan is controlled by the motor.
  8. Move a weight using a motor inside a ball to move the robot.
  9. Land paddle robot that uses two legs attached to motors to spin around and move forward.
  10. Crawler with four legs using a motor to imitate a walking motor.
  11. Attach two ropes and use the motors to reel in the ropes to move the robot between the two points.
  12. The robot has a proximity sensor that moves away from any object that comes close to it, moving using two motors.
  13. A robot that politely asks to go where no robot has gone before.

Sketches:

http://imgur.com/a/lHI5G#0

http://imgur.com/a/lHI5G#1

http://imgur.com/a/lHI5G#2

Video and Captions:

http://imgur.com/a/lHI5G#3

http://imgur.com/a/lHI5G#4

http://imgur.com/a/lHI5G#5

http://imgur.com/a/lHI5G#6

http://imgur.com/a/lHI5G#7

http://imgur.com/a/lHI5G#8

http://imgur.com/a/lHI5G#9

http://imgur.com/a/lHI5G#10

http://imgur.com/a/lHI5G#11

http://imgur.com/a/lHI5G#12

http://imgur.com/a/lHI5G#13

http://imgur.com/a/lHI5G#14

List of Parts:

arduino
3 1N4001 diodes
3 PN2222 transistors
2 small 6V DC motors
2 light sensors
4 330 Ω resistors
wires
alligator clips
plastic knife
styrofoam plate/bowl
tape

Instructions:

To build our robot, you must create two main modules:

1. The first is the robot itself. Start with a paper bowl. This will be the body of the robot. Flip the bowl upside-down and attached to the bottom (open-side) two dc motors opposite each other. Stabilized these motors by laying a plastic knife between them and taping that on top. Connect these motors up to the umbilical which will connect the two modules. To create the wheels, cut the bases off of two plastic cups. Add tape around these bases to add friction Cut a hole in the middle of these cups and stick it to the motor axels. Finally, tape the two light sensors to the front of the top of the bowl. Attach wire to the ends of these. Finally, bundle all of the wires leading from the motors and sensors together into an umbilical.

2. Finally, to create the hand-held controller. Take the cords from the umbilical and connect them through a breadboard according to the provided schematic. Take the breadboard, Arduino and battery pack, and tape them together to form the hand-held controller.

Source Code:

/*
Adafruit Arduino - Lesson 14. Knob
*/
int R = 2;
int L = 3;

int rLight = 0;
int lLight = 1;

void setup() 
{ 
  pinMode(R, OUTPUT);
  pinMode(L, OUTPUT);
  Serial.begin(9600);
  while (! Serial);
  Serial.println("Speed 0 to 255");

} 
 
 
void loop() 
{ 
  int rRead = analogRead(rLight);
  int lRead = analogRead(lLight);
  int rSpeed = map(rRead, 0, 300, 0, 255);
  int lSpeed = map(lRead, 700, 900, 0, 255);
  Serial.print("rSpeed: ");
  Serial.print(rRead);
  Serial.print(" lSpeed: ");
  Serial.println(lRead);
      analogWrite(R, lSpeed);
      analogWrite(L, rSpeed);
} 


P3 – Name Redacted

Group 20 – Name Redacted

Brian worked on the project summary and the discussion of the three prototypes.

Ed worked on the prototype that modeled the TOY programming machine.

Matt worked on the prototype corresponding to the binary lesson.

Josh worked on the prototype for the tutorial to teach instructors how to use this system.

We all worked on the mission statement.

Rational for the Assignment: Most school districts do not teach computer science and are constrained by technological costs and teacher training.  Our project hopes to rectify these two problems by creating an easy to use, fun, and interactive computer program that allows students to learn the fundamentals of computer science without the need for expensive hardware and software.  Our end goal is to create a project that allows users to “code” without typing on a computer.  Thus, this prototype gives us a great opportunity to test the feasibility of this design.  From a user perspective there is very little difference between taping paper to a whiteboard and having us draw in the output from putting magnets on the whiteboard and have a projector show the output generated by the computer.  Thus, we hope that the low-fidelity prototype can give us not only an accurate depiction of how the user will interact with the final system but also provide valuable insight into how to improve the overall user experience (especially since the goal is to create fun and interactive experience for middle school students).

Mission Statement:  Our group strives to provide every student with a method to learn the fundamentals of computer science in a tangible, fun, and interactive way.  Most schools in the country do not teach computer science because of resource and financial limitations.  However, computer science is one of the fastest growing industries, creating a wide gap between the supply and demand of computer programmers.  By creating a cheap and effective way to teach  the fundamentals of computer science, we hope to give students from all socioeconomic backgrounds the ability to become computer programmers.

Updated Task: We switched our difficult task from the Simplified Turtle Graphics to the teaching of the TOY Lesson to instructors.  Since interviewing an instructor in P2, we realized that a large part of the success of our project relies on teaching instructors how to use the system.  Thus, since our user group expanded from only students to students and teachers, it made sense to focus one task on how instructors would use our interface.

Description of Our Prototype: Our prototype uses paper cards with “fake” AR Tags and labels that look similar to those in a real system.  We used tape on the back of the cards to mimic how users will put magnetic or otherwise adhesive cards onto a whiteboard.  Our prototype obviously does not rely on a projector or web camera, and so we used whiteboard markers to emulate the information that the program would project onto the whiteboard.  For the tutorial we drew what the whiteboard would look like as the user stepped through the program.  We have 16 number cards (for 0 to f) and labels for binary, octal, hexadecimal, decimal, LABEL, MOV, PRINT, ADD, SUB, JNZ

Completed program

Completed program

This is where the program outputs.

This is where the program outputs.

This is where the memory is displayed.  Our interviewed potential users said that understanding memory was a very difficult concept to grasp.

This is where the memory is displayed. Our interviewed potential users said that understanding memory was a very difficult concept to grasp.

Completion of program with output.

Completion of program with output.

This is where the code goes (the students places the magnetic blocks here).

This is where the code goes (the students places the magnetic blocks here).

Task 1 – Teaching Binary:

The objective of this task is to provide a simple, clean, and interactive teaching environment for students to learn the difference between different number bases (specifically binary, octal, hex, and decimal).  For user testing, we would approach this from two angles.  First, we will test what it is like to teach with this tool.  For that, we would have the tester imagine they are teaching to a classroom of students and using this as an aid in the lesson.  Second, we can see the test through the eyes of the students.  Our tool is meant to be interactive, so after a quick lesson on what the tool is and how it works, we might ask students to complete quick challenges like trying to write 10 in binary.  The point of this system in both cases it to try and simplify the teaching process and increase engagement through interactivity.


Imagine you are teaching a lesson.  The basic idea of our UI is that there are 4 numerical base cards:


And 16 number cards:


They have adhesive on the back and they stick to the white board.  Users then place these cards on the board.  In our real system, we would project output on top of the board and cards, but for this lo-fi prototype, we will use marker, written by the tester, instead.


The first way that you could use the system is to put one numerical base card down and place a string of numbers after it.  The system will interpret that string of numbers in the base and provide a representation of that quantity.  In the below example, it displays balls.


Another way using the system would be to put down more than one numerical base cards and then place a string of numbers following just one of those card.  The system would then populate strings of numbers following the other bases so that they are all equivalent.


If the user places down something that is not valid (such as a value beyond the base), we would use highlighting from the projector to let them know their error.


Task 2 – TOY Programming:

This lesson is used to teach the fundamentals of how all computers work. We provide users cards with a simplified version of assembly language and visual tags printed on them. The teacher or student will use this system to learn about computation and simple logic in a classroom setting. As the user places cards on the board, the projector will overlay syntax highlighting and other visual cues so the user gets feedback as he or she is writing the program. Then, when the user is done writing the program, they place the RUN card on the board. The system first checks if the program is syntactically correct and, if not, displays helpful messages on the board. Then, the system walks through the code step by step, showing the contents of memory and output of the program. As the commands are all very simple and straightforward, there is no confusing “magic” happening behind the scenes and it will be very easy for students to understand the core concepts of computation. However, the language is complete enough to make very complex programs. Our paper prototype very closely resembles the form of our final project. We created the visual tags out of paper and stuck them on a whiteboard using tape. We mimicked the actions of the projector by drawing on the board with markers.

This slideshow requires JavaScript.

Task 3 – Teaching Tutorial:

The purpose of the tutorial would be to familiarize users – the teacher in particular – with the main display interface and teach them how to properly use the instruction cards. Prior to starting the tutorial, the user will need to be given basic instructions on what the system is, why it is useful, and how to setup the system and run the program. Once started, the user should not need any additional help. Text and prompts will be projected on the screen to guide the user through the tutorial, teaching him what the different parts of the display represent and how to properly use each instruction card. The tutorial will advance to the next step when after a certain period of time has elapsed, the user has completed a designated task, or the user presses a continue key such as the space bar the the computer. Mistakes can be recognized and corrected by the system itself if the user does something wrong.

This slideshow requires JavaScript.

Discussion of Prototype:

We made our prototype by first creating blocks that were similar to how they would appear on the magnets that the users will use.  The blocks have AR Tags (which for now we made up), and a label.  There are blocks for all of the numbers from 0 to f,  and blocks with keywords that are supported in the “computer language” we are developing. Another part of our prototype was drawing on the whiteboard how the whiteboard will look during a lesson. This meant creating the three sections that will be projected – code, memory, and output. We wanted to draw these sections on the whiteboard for our prototype since they change real time for our project and thus we could emulate with markers what the user will see when they use our program. By using the whiteboard, we used a new prototyping technique. We believed that it was more suitable than paper because of the increased flexibility it gives us over paper. When we test our prototype with real users, we want the freedom to display the correct output, memory and error messages. This would have required too much paper since we have many different possible values in each of the four registers at any given moment, among other things. Also, since our system will rely on the whiteboard, it made sense to have the users interact with a whiteboard when testing our prototype.

One of the challenges that we had to confront arises from the primary user group being younger students.  Thus, we had to keep the tags simple and few enough that students could reasonably understand what they did yet we still wanted a reasonable amount of functionality.  It was difficult to come up with a good whiteboard interface for the users.  We wanted something simple that still conveyed all of the useful information.  One idea that we considered was an input tag that would allow the user to input data to the TOY program.  We decided however that this made the programming unnecessarily complex while not adding that much benefit.  Most of the difficulty in creating the prototype was similar, and the issue came from deciding what functionality to include that would offer a complete introduction to the material without overly complicating the learning process.  Even though using the whiteboard rather than paper presented some difficulties, I think it works very well in terms of simulating the program.  It was also important that our prototype not lay flat on a surface, since the final project will use a projector image on a whiteboard.  I think our prototype very closely resembles how we currently think the end product will look.

P2 – Name Redacted

Group Number: 20

Members:

Brian conducted one interview on his own and partnered for another interview and helped write the paragraphs on the interviews.

Matt conducted one interview on his own and partnered for another interview and helped write the paragraphs on the interviews.

Josh answered the 11 task analysis questions and helped Ed write the three storyboards and answer the interface design questions.

Ed helped Josh answer the 11 task analysis questions and wrote the three storyboards and answered the interface design questions.

Problem and Solution Overview
Currently, there is very little teaching of computer science fundamentals taught in middle school and high schools. Often, schools are prevented from teaching CS because they have insufficient computer resources to provide each student with a computing environment. Even in college, some students have difficulty learning the basic concepts such as binary number representation, memory, and recursion. The barrier of entry to learning CS is just too high. We are hoping to create an interactive method for teaching the fundamentals of computer science that does not rely on coding software on a computer. We wish to extend the idea of whiteboard programming. Using computer vision and a projector, we want to let users place “blocks” of code on the board and our tool will return visual feedback. Our solution could provide a low cost and interactive interface that could revolution technology teaching to the masses.

Description of Users Observed
Our target user group is divided into two main groups: teachers using our tool for pedagogy and students learning from our tool. We decided to select three users across both of these groups to get the most balanced perspective.

  • The first user that we observed created and teaches an introductory CS course targeted at students with almost no technical background (often students from humanities departments). We think that he was a good choice for a user group not only because he has had years of teaching experience, but also because he is often recognized by his students as being an extremely effective and engaging educator. He is extremely interested in CS education although his background and interest tend to be focused on a slightly older age group than we are targeting.
  • The second user that we interviewed was a student who took the above course. He had no technical background for the course and had a heavily humanities background. We thought he was a good user to interview because we were able to talk to him about the frustrations and confusions of learning the most simple CS. Also, we were able to compare his interview with the above interview readily.
  • Our final interviewee was a member of the school board of a large suburban district near Los Angeles. He is been extremely interested and involved in education reform. We thought he would provide an interesting insight into the backend of education. He helped us to understand how teachers might adopt and use this technology from an institutional standpoint.

CI Interview Description
Our first interview was conducted in the office of the user. We started out by explaining a little about who we were and what the goals of our project was. We then asked him to walk us through a couple of his extremely early lessons to help us get a picture of what current teaching practices are. Our second interview was conducted in a classroom with a student who had taken the aforementioned introductory computer science course. The student is concentrating in a nontechnical field but took the computer science course to fill in a distribution requirement and learn some fundamental computer concepts. We asked the student to walk through some of his previous code in the course, explaining what he did in the assignment. Our final interview took place in a common space. This interview was tricky to take the perspective of contextual interview. As we will discuss later, professional development for teachers is extremely individual and therefore hard to observe. We therefore made sure to talk about specifics from a more distant perspective.

Our first user, the professor, provided us with an outline of the first few weeks of lectures, and discussed how he explains various concepts ranging from binary to memory to logical loops. Our second user, the student, talked briefly about what he liked and disliked about the introductory computer science class he took. In particular, he liked learning about internet security issues as well as computer coding. However, the coding portion of the class was the most difficult for this student to learn. As part of the interview, I asked the student to go through some of his code from the computer science class that he took. When going through the HTML code that he written, he noted in many places where he had to fix syntactical errors. Most of his errors in this particular program came from omitting the ‘/’ character from the end tags. Similarly, his JavaScript errors were almost entirely syntactical, usual because of a missing or extra ‘}’ character. Both the professor and the student agreed that binary was a very hard concept to teach/learn. In particular, the student suggested that most students struggle with the concept of how many decimal numbers can be represented by n bits. Both also agreed that a very difficult concept in computer science is how all computers are actually equivalent, and how languages can all do the same computation. The professor also mentioned that most students have an incredibly difficult time understanding the abstractions of the computer process. In particular, the student had trouble understanding compiling, assembling, and linking because the concepts were too abstract. However, the professor and student disagreed on some issues. Firstly, the professor believed that students struggled most on the idea of memory and more specifically the actual holding of memory. While the student admitted that memory was difficult, he believed that more students had trouble with binary representations of numbers. The student also emphasized that he was most frustrated by the syntax problems that he encountered while coding.

After having looked into a teaching lesson itself, we wanted to take a step back and gain more perspective on what it’s like to be a teacher. This is where we turn to our last interview. Our final interviewee, as a member of a school board, has a big picture knowledge of what fundamentally it is like to learn how to teach. The main takeaway we got from the interview is that current pedagogical education is extremely individual. He walked us through all of the professional development activities that a teacher does in a given year (including professional development conferences and school events). They were very few of them (~5 days per year) and individually focused. Teachers make their own lesson plans and learn new technological tools on their own. He talked us through the process of integrating iPads into his district and how poorly they are used by many teachers. This individuality contradicts our first interview slightly. Our first user actually published the notes of his class in a book so other teachers could use them to shape their lessons. I would explain that difference as being the difference between K-12 and college education. Ultimately, I think that for the context of our project, we have to understand that K-12 teachers wouldn’t have much support in learning how to use our tool. It must be self-contained, self-teaching, and extremely foolproof if we hope to gain traction with this audience.

Task Analysis Questions
1. Who is going to use the system?
Our target audience is the typical classroom. We envision the product being used with about 20 students and a single teacher. The students don’t need to have any background in CS or experience coding.

2. What tasks do they now perform?
Current CS education tends to be done with “whiteboard coding.” This is the practice of writing code on a whiteboard to demonstrate the features. Other practices commonly used is simple lecture style and for certain concepts, teachers use abstract drawings. For example, when students first learn about memory, it is often represented with a box to be filled with data. These abstractions of data are very important, as students can quickly get confused when exposed to the more complicated principles that lie under them.

3. What tasks are desired?
Typically, educators are looking for a tool to help boost the understanding of their students in a classroom setting. Having the ability to present basic concepts of CS to students in a way that is easy to visualize, grasp, understand, and interact with is very desirable. Additionally, having a teaching tool that students can use and get feedback from without need to have the teacher on hand to always give direct instructions is very useful as it allows students to continue to learn on their own and at their own pace.

4. How are the tasks learned?
Currently, teaching is an extremely self-taught process. Teachers individually come up with their own lesson plans. In our system, tasks could be learned through a simple tutorial lesson that would introduce the students to the basic operations and principles behind our system. Concepts would be introduced one at a time and the interactions between could be demonstrated as students make progress.

5. Where are the tasks performed?
Classrooms with a projector and whiteboard. Only a few computers for a lot of students. Our system could potentially operate on any smooth surface to which ID tags could be easily attached and moved around.

6. What’s the relationship between user & data?
Users could potentially have personal profiles that track their progress throughout the lessons. When using the system in a group setting, the system could controlled by the teacher to set up lessons and track the progress of the class as a whole.

7. What other tools does the user have?
Textbooks, the internet, Toy programming languages (e.g. Scratch)

8. How do users communicate with each other?
Teachers communicate with their students in a classroom setting. The Teachers can give their students guidance and instructions as they use the system, and the students can freely ask questions about the current lesson.

9. How often are the tasks performed?
Students would go through a lesson about 2-3 times a week. Multiple lessons could potentially be completed in one class session if they are short.

10. What are the time constraints on the tasks?
Class session usually last about an hour. This should be plenty of time to go through most lessons. However, more difficult and complex tasks may need to be broken up into multiple lessons spanning multiple days.

11. What happens when things go wrong?
Ideally, any errors encountered would be a result of improper set up by the user, not flaws in the code itself. If something does go wrong such as the project getting out of alignment in the whiteboard or the camera has trouble reading the ID tags, users could simply tell the system to recalibrate. All data and current lesson progress would be saved. Data should be saved periodically regardless to ensure that if the system fails completely, the users’ current progress is still preserved.

Description of Four Tasks
Tutorial – How to Teach a Lesson (Storyboard not included)
This purpose of this lesson would be to provided a ground work for the teacher and students to build and to teach them the basic principles of using our system. This lesson could include walk throughs of specific lessons they should be teaching. Highlighting blocks and stepping them through each part of the process. Currently, this is an individual learning task done by teachers. They read textbooks and compile a lesson plan. We would hope to significantly reduce the difficulty of this process.

Teaching Number Base (e.g. Decimal, Binary, Octal, Hex)
Our first two interviews both said that one of the hardest things for early tech students to learn is binary. This is something that is fundamental to CS but can be conceptually very challenging to students. We hope to help the students to better understand number base through visualization. We imagine they would place Binary/Octal/Hex/etc. tiles on the board. They would then see how different number systems represent numbers. This would be a moderately difficult task to perform with our system but one that is currently very hard.

Teach First Toy Program (I/O and intro looping)
Another suggested teaching example from our interviews was an extremely simple toy programing lesson. The lesson essentially works through each of the fundamental parts of a computer and provides a simplified example:

Read in a number from input and print (intro. to I/O)
Read in a number from input, do an operation, and print (intro. to processing)
Read in two numbers from input, print the product (intro. to memory)
Read in numbers from input until a 0 is given. Calculate the sum and print (intro. to loops)
We would create these programs with simple code put on the board and inputs placed on the board as well. This lesson (especially memory) is something that is currently difficult to teach and learn but we hope to reduce that difficulty.

Simplified Turtle Graphics
Our final lesson is the most complex. We want to create a tactile version of the Logo programming language library. Users could control the movement of a virtual turtle and see how his path changes as they change various part of code on the board. This would be a great way to introduce functions and show the execution of the program in a visual manner. It would use:

Create “Function” cards that would allow users to define custom operations
Only uses a basic set of commands, such as forward, turn, and pen color.
This language is well established a good way to teach new students about programming but the difficulty is it often requires a computer for each student. We plan to reduce that difficulty by adapting the program to our tool, requiring only one computer per classroom.

Interface Design
The user can teach and interact with a variety of lessons on computer science topics. By placing a “lesson” card on the board, the system reacts and projects the interface for that lesson. Then, the user can add physical cards to the board in the relevant areas (eg. Binary values, Code, Input, etc..) and the system will react by showing the execution and output of the program. Unlike any current solution, our system allows a teacher or professor to visually demonstrate to an entire class these computer science topics. The interactivity of our system allows the teacher to make quick, visual changes to the program or input to demonstrate how the output will change. We believe that this will be an engaging, fun, and flexible way to teach students important topics in CS.

Storyboards
Teaching Number Base

This slideshow requires JavaScript.

Teach First TOY Program (I/O and intro looping)

This slideshow requires JavaScript.

Simplified Turtle Graphics

This slideshow requires JavaScript.

Sketch of the System

Photo 2013-03-11 04.46.49 PM

Lab 2 – Name Redacted

Names: Brian, Matt, Joshua, Ed

Group Number: 20

We built a capacitive piano with four keys. In the final iteration, you can play one note at a time but the sound is continuous for as long as it is pressed. Our creative add on is including a nob (potentiometer) that allows a user to change the pitch. It was successful in that it creates interesting tones and we can push the idea of duets on the same instrument. In the final performance, the two performers performed different duties while simultaneously working together to create a beautiful sound. In the future, we would like to add more dynamic music instead of a single tone. We would also create more roles for additional people to further our idea of multiple individuals performing on the same instrument. Finally, we would like to add some tactile feedback to the capacitive keys so that there is a physical response to the individual playing the music.

Prototype 1: Four capacitor sensors for four different notes. The notes are distinct and played one at a time but if two keys are pressed, they are played sequentially to create pseudo-chords.

// Graphing sketch
//Adapted from http://arduino.cc/en/Tutorial/Graph 

import processing.serial.*;

 Serial myPort;        // The serial port
 int xPos = 1;         // horizontal position of the graph

 int zero_pos;
 int one_pos;
 float max_pos;
 float min_pos;


 void setup () {
	 // set the window size:
	 size(1080, 720);
	 max_pos = height; 
	 min_pos = 0;       

	 // List all the available serial ports
	 // println(Serial.list());
	 // I know that the first port in the serial list on my mac
	 // is always my  Arduino, so I open Serial.list()[0].
	 // Open whatever port is the one you're using.
	 myPort = new Serial(this, Serial.list()[0], 9600);
	 // don't generate a serialEvent() unless you get a newline character:
	 myPort.bufferUntil('\n');
	 // set inital background:
	 background(224,228,204); 
	}
	void draw () {
 	// everything happens in the serialEvent()
 }
 
 void serialEvent (Serial myPort) {
	 // get the ASCII string:
	 String inString = myPort.readStringUntil('\n');

	 if (inString != null) {
		 // trim off any whitespace:
		 inString = trim(inString);

		 if (inString.length() != 0) {
		 	String[] sensor_strings = inString.split(" ");

		 	if (sensor_strings.length < 3) {
		 		println("RETURN");
		 		return;
		 	}

		 	float inByte = float(sensor_strings[0]); 
		 	inByte = map(inByte, 0, 1023, 0, height/3);

		 	float yPos = height;
		// draw the line:
		stroke(105,210,231);
		line(xPos, yPos, xPos, yPos - inByte);
		yPos -= (inByte + 1);

		inByte = float(sensor_strings[1]); 
		inByte = map(inByte, 0, 1023, 0, height/3);

		stroke(167,219,216);
		line(xPos, yPos, xPos, yPos - inByte);
		yPos -= (inByte + 1);


		inByte = float(sensor_strings[2]); 
		inByte = map(inByte, 0, 1023, 0, height/3);

		stroke(250, 105, 0);
		line(xPos, yPos, xPos, yPos - inByte);


		if ((yPos-inByte)  min_pos) {
			min_pos = yPos-inByte;
		}
		drawMax(max_pos);
		drawMax(min_pos);


		 // at the edge of the screen, go back to the beginning:
		 if (xPos >= width) {
		 	xPos = 0;
		 	max_pos = yPos-inByte;
		 	min_pos = yPos-inByte;
		 	background(224,228,204); 
		 } 
		 else {
		 // increment the horizontal position:
		 xPos++;
		}
	}
}
}

void drawMax(float max_pos) {
	stroke(255, 0, 0);
	ellipse(xPos, max_pos, 2, 2);
}

Prototype 2: We are extending prototype 1 but now have a potentiometer that shifts the tone of all of the notes. This allows the instrument to have a larger range than just the four notes presented.

#include <CapacitiveSensor.h>


/*
 * CapitiveSense Library Demo Sketch
 * Paul Badger 2008
 * Uses a high value resistor e.g. 10 megohm between send pin and receive pin
 * Resistor effects sensitivity, experiment with values, 50 kilohm - 50 megohm. Larger resistor values yield larger sensor values.
 * Receive pin is the sensor pin - try different amounts of foil/metal on this pin
 * Best results are obtained if sensor foil and wire is covered with an insulator such as paper or plastic sheet
 */
 
int speakerPin = 7;
int knobPin = 1;
int knobVal = 0;

int threshold = 3000;


CapacitiveSensor   cs_0 = CapacitiveSensor(3,8);        // 10 megohm resistor between pins 4 & 2, pin 2 is sensor pin, add wire, foil

CapacitiveSensor   cs_2 = CapacitiveSensor(2,10);        // 10 megohm resistor between pins 4 & 2, pin 2 is sensor pin, add wire, foil

CapacitiveSensor   cs_4 = CapacitiveSensor(4,12);        // 10 megohm resistor between pins 4 & 2, pin 2 is sensor pin, add wire, foil

CapacitiveSensor   cs_6 = CapacitiveSensor(6,13);        // 10 megohm resistor between pins 4 & 2, pin 2 is sensor pin, add wire, foil

void playTone(int tone, int duration) {
  for (long i = 0; i < duration * 1000L; i += tone * 2) {
    digitalWrite(speakerPin, HIGH);
    delayMicroseconds(tone);
    digitalWrite(speakerPin, LOW);
    delayMicroseconds(tone);
  }
}

void playNote(char note, int duration) {
  char names[] = { 'c', 'd', 'e', 'f', 'g', 'a', 'b', 'C' };
  int tones[] = { 1915, 1700, 1519, 1432, 1275, 1136, 1014, 956 };

  // play the tone corresponding to the note name
  for (int i = 0; i  threshold) {
     playNote('c', 100); 
    }
    
    if (total_2 > threshold) {
     playNote('d', 100); 
    }
    
    if (total_4 > threshold) {
     playNote('e', 100); 
    }
    
    if (total_6 > threshold) {
     playNote('f', 100); 
    }
    

//    Serial.print(millis() - start);        // check on performance in milliseconds
//    Serial.print("\t");                    // tab character for debug windown spacing
//
//    Serial.println(total);                  // print sensor output 1
    

    delay(10);                             // arbitrary delay to limit data to serial port 
}

Prototype 3: We extending prototypes 1 and 2 so that now the notes play continuously until the user releases his/her finger from the key. The potentiometer can shift the note while it is playing.

#include <CapacitiveSensor.h>


/*
 * CapitiveSense Library Demo Sketch
 * Paul Badger 2008
 * Uses a high value resistor e.g. 10 megohm between send pin and receive pin
 * Resistor effects sensitivity, experiment with values, 50 kilohm - 50 megohm. Larger resistor values yield larger sensor values.
 * Receive pin is the sensor pin - try different amounts of foil/metal on this pin
 * Best results are obtained if sensor foil and wire is covered with an insulator such as paper or plastic sheet
 */
 
int speakerPin = 7;

int knobPin = 1;

int threshold = 5000;

int knobVal = 0;


CapacitiveSensor   cs_0 = CapacitiveSensor(3,8);        // 10 megohm resistor between pins 4 & 2, pin 2 is sensor pin, add wire, foil

CapacitiveSensor   cs_2 = CapacitiveSensor(2,10);        // 10 megohm resistor between pins 4 & 2, pin 2 is sensor pin, add wire, foil

CapacitiveSensor   cs_4 = CapacitiveSensor(4,12);        // 10 megohm resistor between pins 4 & 2, pin 2 is sensor pin, add wire, foil

CapacitiveSensor   cs_6 = CapacitiveSensor(6,13);        // 10 megohm resistor between pins 4 & 2, pin 2 is sensor pin, add wire, foil

void playTone(int tone, int duration) {
  for (long i = 0; i < duration * 1000L; i += tone * 2) {
    digitalWrite(speakerPin, HIGH);
    delayMicroseconds(tone);
    digitalWrite(speakerPin, LOW);
    delayMicroseconds(tone);
  }
}

void playNote(char note, int duration) {
  char names[] = { 'c', 'd', 'e', 'f', 'g', 'a', 'b', 'C' };
  int tones[] = { 1915, 1700, 1519, 1432, 1275, 1136, 1014, 956 };

  // play the tone corresponding to the note name
  for (int i = 0; i  threshold) {
     note_playing = true;
     playNote('c', 100); 
    }
    
    if (total_2 > threshold) {
     note_playing = true;
     playNote('d', 100); 
    }
    
    if (total_4 > threshold) {
     note_playing = true;
     playNote('e', 100); 
    }
    
    if (total_6 > threshold) {
     note_playing = true;
     playNote('f', 100); 
    }
    
    if (!note_playing) {
     noTone(speakerPin); 
    }
    

//    Serial.print(millis() - start);        // check on performance in milliseconds
//    Serial.print("\t");                    // tab character for debug windown spacing
//
//    Serial.println(total);                  // print sensor output 1
    

    delay(10);                             // arbitrary delay to limit data to serial port 
}

List of parts:
4 1MegaOhm resistor
1 potentiometer

4 pieces of aluminum foil
4 alligator clips
1 Arduino
1 Buzzer

Detailed Instructions:
To make the keyboard, tape four strips of foil to a piece of paper, making sure to leave one end lose so you can connect them later and the top of the other end exposed so you can actually touch the foil. To make the key sensors themselves, take a 10M Ohm resistor and connect it to a digital output pin. Then connect the other end to a digital input pin. Connect one end of an alligator clip to the input-side of the resistor and connect the other end to the exposed end of one of the pieces of foil. Repeat this process for the three other keys.
For the pitch control, take a potentiometer and connect one pin to 5V, the middle pin to an analog input pin, and the last pin to ground.

Assignment 2 – Brian Matejek

Observations
Professor Finkelstein – before COS 426 lecture on Thursday, February 28.
Professor Finkelstein showed a short video clip about font types to the class starting five minutes before class started. The clip was only tangentially related to the class in general, and not related to the current day’s lecture, and most people were not paying attention to the video. The majority of students were on their computers checking their email and Facebook. Students were not interacting at all with the material or the video right before the class. Some students were talking among themselves. Professor Finkelstein did not provide an introduction to the video, but rather just started playing the video before class started. In previous lectures, he has demoed applications on the projector of some graphics theory that we had learned. However, even then, since it is before class, most students are not paying attention. There is very little interaction with the course material in the few spare minutes students have before COS 426 lecture.

Various Students – 10 minutes between COS 426 and COS 436 lectures – Tuesday, February 26.
COS 426 goes from 1:30 to 2:50 in CS Building 105, and COS 436 goes from 3:00 to 4:20 in CS Building 104. Since the rooms are less than 50 feet apart, students that are in both classes have 10 spare minutes between the classes. Often, COS 426 gets out early and the students have even more spare time. Some students talked outside of CS Building 104, but there was a previous class still in session and one of the preceptors had to close the door. Some students went on their laptops in the 10 minutes to check their email, Facebook, and go on Reddit. I did not see any students looking at either COS 426 or COS 436 lecture slides. There is really very little interaction between the students and the course material that they are studying. Some students just stood around their next classroom looking bored with no one to talk to and nothing productive to do. Matt Dolan was discussing his HCI Project and brainstorming some people that he could interview for P2. Overall, most students were not very productive and the few students who were productive could definitely be much more productive.

Richard Lee – Tuesday, February 26
Richard had HIS 392 lecture in McCosh 62 and then had to walk to McCosh B11 for the precept of the same class. Richard took 5 minutes to walk to precept, although he could have taken a more direct route but decided to instead walk with his friends for a few minutes. When Richard finally made it to precept, he sat down and rested for the last five minutes before class started. He said that more rest time would be useful. I asked him what he does on days where he does not rest before precept. He said that he finds quotes for precept in the readings that he “may or may not” have read. Although Richard would have preferred to walk further with his friends, he did not know when he should start heading back to class.

PHI 340 Precept – last semester, every Tuesday
Although this observation was not this semester, I wanted to include it as a fourth because I was very intrigued by the problem that I saw. One student, Max, had class from 10:00 until 4:30 every Tuesday, with no breaks for lunch – every class started 10 minutes after the previous ended. My philosophy precept started at 12:30 every Tuesday. However, since Max did not have a lunch break, he would run to the dining hall after his 12:20 class, eat quickly, and show up to precept 20 minutes late. Although the professor understood, there is definitely a better way for Max to both eat and attend his classes.

Brainstorming
Collaborators: Mark Whelan, Mianna Chen, Richard Lee, Doug Stuart
Map based and social traveling applications:
1. A map that shows the quickest route to get to class, including cutting through buildings on campus
2. A friend based application to find out where friends are going to and from to walk together
3. An application that gives a path to minimize outdoor traveling time if it is cold or raining outside

Rest and timing based applications:
4. Voice activated alarm clock – wake up from naps when the professor starts lecturing
5. Application that sets alarms before classes that have larger breaks before starting (i.e. not 10 minutes) to make sure the student is awake and out of the dining hall
6. Application that makes sure the student has started walking towards class with enough time to arrive on time

Educational based applications:
7. A way for students to provide feedback to professors about the last lecture and a method for professors to look at the results on their phone and/or computer before the next lecture
8. A productive way to work on homework assignments in the ten minute intervals between classes
9. Application that allows a student to review the quotes and readings before precept
10. Top 10 news articles of the day summarized in paragraphs that take 1 minute or less to read
11. Audio notes of the last lecture while walking to class so a student can review the material while in transit

Social based applications
12. An application that outlines a student’s daily schedule for the day, possibly with time blocks allocated for particular homework assignments, group meetings, etc.
13. Application that allows a student to walk away from a class with friends but notifies the student when they should return back to class to make it on time

For students with no lunch period:
14. An application that allows the student to order food from his phone before 11:30, and pick up a sandwich package at Frist or the Center for Jewish Life to eat in the beginning of his next class
15. An application that says if any friends are coming from the dining hall so that you can ask them to bring you food in a takeout box
16. An application that looks at the free food list-serv and dining menus to determine the best dining hall or event to go to between classes to quickly grab food

Well being applications
17. Application that tells users where to store books around campus and when it is optimal for them to pick the books up to minimize the weight of backpacks
18. Some kind of physical or mental health activity between classes, or perhaps a nutrition application that teaches the student

Prototype Ideas
Ordering Food at Frist or CJL
Students who do not have a lunch either have to be even later for precept or skip lunch, and neither option is healthy or conducive for a good learning environment, which presents an even greater problem than wasting ten minutes when early to class.
News Application
Most students do not have time to keep up with current events at Princeton and this application would provide a simple and easy interface to give students the most relevant information on the top ten news articles in various categories.

Prototypes
Ordering Food at Frist or CJL
IMG_0282

Main screen on iPhone or Android

IMG_0283

CAS login screen to create accountability – students cannot order food and not pick up

IMG_0284

Pick up times are the possible 10 minute intervals between classes, ranging from 11:50 to 2:30

IMG_0285

There are four food options: Kosher, Vegan, Vegetarian, and None. Kosher food is picked up at the CJL while the other three options are picked up at Frist.

IMG_0286

Vegetarian Options

IMG_0287

Kosher and None Options (picked up at CJL and Frist respectively)

IMG_0288

Vegan Options

IMG_0289

Options for Drink

IMG_0290

Review and Submit Page – Changing location alternates between Kosher and Non-Kosher meals

News Application

IMG_0291

Main screen on iPhone or Android

IMG_0292

Different categories of articles a user can select

IMG_0293

Listed entertainment articles

IMG_0294

Listed science articles

IMG_0295

Listed culture articles

IMG_0296

Listed world news articles

IMG_0297

Listed politics articles

IMG_0298

Listed sports articles

IMG_0299

Individual science article, more links to main CNN (or other news network) article. Random returns a random article

IMG_0300

Individual culture article, more links to main CNN (or other news network) article. Random returns a random article

IMG_0301

Individual world news article, more links to main CNN (or other news network) article. Random returns a random article

IMG_0302

Individual politics article, more links to main CNN (or other news network) article. Random returns a random article

IMG_0303

Individual entertainment article, more links to main CNN (or other news network) article. Random returns a random article

IMG_0304

Individual sports article, more links to main CNN (or other news network) article. Random returns a random article

Prototype Testing

I decided to test the News Application

Mianna Chen
IMG_0305

Mianna enters the application

IMG_0306

and chooses to look at culture articles.

IMG_0307

She chooses an arbitrary article

IMG_0308

and is brought to the article page.

IMG_0309

She is confused about what “more” actually does – not specified well in prototype.

IMG_0310

She chooses to look at another category

IMG_0311

and looks at World News articles.

IMG_0312

She clicks on the random button

IMG_0313

and is brought to a random sports article. She wanted to get a random World News article or at least the Sports menu, not just any random article. Mianna is looking for an easy way to get back to the last article but there is none currently.

Cameron Henneberg

IMG_0314

Cameron opens up the application

IMG_0315

and selects culture from the list of categories.

IMG_0316

He chooses an article

IMG_0317

and is brought to the article screen.

IMG_0318

He does not like how random brings him to a completely random page and he thinks that there should be an easier way to go back.

Owen Daniels

IMG_0320

Owen enters the application

IMG_0321

and selects a random article.

IMG_0322

This brings him to an article on Culture.

IMG_0323

He then switches categories to sports

IMG_0324

and reads a new article.

Additional Feedback

Mianna Chen
“The random article generator should generate a random article from the same section or for the default sections page.”

She was confused about how to change articles without going back to the main page (not clear that one could swipe the screen to change the article).

She also asked about the “More” button, wondering what it exactly did. It was supposed to bring the user to the main article about which the summary was on.

Cameron Henneberg
“There should be a back button on the article.”

Cameron also believed that random should go back to the same category.

Cameron also asked what the button “More” does.

Owen Daniels
Owen also asked what the button “More” does.

Owen liked the idea of summarizing the article rather than linking to the whole article in the application. He says that he usually goes on espn over news websites because you can look at the score and know what happened. With news websites, there is rarely a synopsis.

Owen also showed me how some CNN articles have bullet points for the article, and said that if he were to read a CNN News article, he would look at the bullet points.

Insights for Future Development
It wasn’t clear that to cycle through the articles users should swipe the screen from left to right and vice versa. Similarly, it was not clear what the “more” button meant. Both of these insights shows that I need to work on not only the naming of the buttons but also on the directions for the application. People did not like how random selected a random article from any category. The two major suggestions were to either choose a random article in the same category or to go to the menu screen for a random category. The navigation between articles also could be improved by including a back button that will allow users to traverse through pages that they have previously seen. Users in general liked how the articles were summarized, and Owen showed me the equivalent in CNN, which could be valuable in terms of finding succinct summaries of the articles. Also, I had a few ideas about how I would revise the application in the future based on the prototype testing. Firstly, I would allow users to “like” articles, and in the future I would show articles that other users with similar interests liked. The random button would try to look for these types of articles of the same category as well.

L1 – Name Redacted

Group Members:
Brian Matejek
Joshua Prager
Matt Dolan
Ed Kelley

Group Number: 20

Photo Sketches:

photo1

This is a picture of a memory game with different sensors. The Arduino would tell the user what order to interact with the sensors by turning on and off LED lights associated with each sensor.

photo2

This is a flex sensor connected to an Arduino that allows users to measure finger strength. Alternatively, one could create a game by trying to match the sensor output with a randomly generated number.

photo3

Our third idea is create a game of pong with different sensors. Competitors will use the sensors to move the paddles up and down on the screen.

photo4

Our last idea is to create some mechanism for students to provide real time feedback for teachers.

What We Built and Why:
We built an education utility that allows the students of a class to provide feedback, through potentiometers mounted in their desks, to a teacher or professor. This feedback is then amalgamated into a single graphic that allows the professor to get a reading of the class at a glance. Our project was definitely successful. We were able to produce a reasonably good graphical display from three simulated “students.” We also added lifetime min and max lines that help the teacher gauge the current confusion level of the class in comparison to the extremes. Going forward, we think there is huge potential for the idea. Possible extensions would be to allow students to provide different types of feedback, such as engagement and confusion. The real extension would be in how we could improve the display of the information to the professor. We are currently using a moving graph over time but added extensions like time decay and even adaptive learning algorithms might help the professor get a better snapshot of the class at a glance.

Storyboard:
photo5

photo6

photo7

photo8

In use:
photo9

Feedback nobs that students control

photo9a

Overall setup

photo9b

Display shown to teacher. Each color corresponds to the sensor readings from each individual student. The two red lines are the maximum and minimum levels of confusing in the frame.

Video

List of All Parts Used:
1 Arduino
Assorted Wires
1 Breadboard
3 Potentiometers

Directions:
The setup for our device is fairly simple. Take a potentiometer and connect the left pin to 5V, the middle pin to analog input A0, and the right pin to ground. Repeat this with two more potentiometers with their middle pins connected to analog inputs A1 and A2 respectively. The rest of the setup is done in software.

Code:

// Graphing sketch
//Adapted from http://arduino.cc/en/Tutorial/Graph 
 
 import processing.serial.*;
 
 Serial myPort;        // The serial port
 int xPos = 1;         // horizontal position of the graph

 int zero_pos;
 int one_pos;
 float max_pos;
 float min_pos;


 void setup () {
	 // set the window size:
	 size(1080, 720);
	 max_pos = height; 
	 min_pos = 0;       

	 // List all the available serial ports
	 // println(Serial.list());
	 // I know that the first port in the serial list on my mac
	 // is always my  Arduino, so I open Serial.list()[0].
	 // Open whatever port is the one you're using.
	 myPort = new Serial(this, Serial.list()[0], 9600);
	 // don't generate a serialEvent() unless you get a newline character:
	 myPort.bufferUntil('\n');
	 // set inital background:
	 background(224,228,204); 
 }
 void draw () {
 	// everything happens in the serialEvent()
 }
 
 void serialEvent (Serial myPort) {
	 // get the ASCII string:
	 String inString = myPort.readStringUntil('\n');

	 if (inString != null) {
		 // trim off any whitespace:
		 inString = trim(inString);

		if (inString.length() != 0) {
		 String[] sensor_strings = inString.split(" ");

		 if (sensor_strings.length < 3) {
		 	println("RETURN");
		 	return;
		 }

		float inByte = float(sensor_strings[0]); 
		inByte = map(inByte, 0, 1023, 0, height/3);

		float yPos = height;
		// draw the line:
		stroke(105,210,231);
		line(xPos, yPos, xPos, yPos - inByte);
		yPos -= (inByte + 1);

		inByte = float(sensor_strings[1]); 
		inByte = map(inByte, 0, 1023, 0, height/3);

		stroke(167,219,216);
		line(xPos, yPos, xPos, yPos - inByte);
		yPos -= (inByte + 1);


		inByte = float(sensor_strings[2]); 
		inByte = map(inByte, 0, 1023, 0, height/3);

		stroke(250, 105, 0);
		line(xPos, yPos, xPos, yPos - inByte);


		if ((yPos-inByte)  min_pos) {
			min_pos = yPos-inByte;
		}
		drawMax(max_pos);
		drawMax(min_pos);


		 // at the edge of the screen, go back to the beginning:
		 if (xPos >= width) {
			 xPos = 0;
			 max_pos = yPos-inByte;
			 min_pos = yPos-inByte;
			 background(224,228,204); 
		 } 
		 else {
		 // increment the horizontal position:
		 xPos++;
		 }
		}
	 }
 }

 void drawMax(float max_pos) {
 	stroke(255, 0, 0);
 	ellipse(xPos, max_pos, 2, 2);
 }

Future Development:
In the future we would like to have the student sensors interact with the teacher’s computer without connecting by wires. Each student would also have multiple nobs so that the students can express different emotions.