Nano-dissection identifies genes involved in kidney disease (Genome Research)

Scanning electron microscope (SEM) micrograph of podocytes
Researchers at Princeton and the University of Michigan have created a computer-based method for separating and identifying genes from diseased kidney cells known as podocytes, pictured above. (Image courtesy of Matthias Kretzler)

By Catherine Zandonella, Office of the Dean for Research

Understanding how genes act in specific tissues is critical to our ability to combat many human diseases, from heart disease to kidney failure to cancer.  Yet isolating individual cell types for study is impossible for most human tissues.

A new method developed by researchers at Princeton University and the University of Michigan called “in silico nano-dissection” uses computers rather than scalpels to separate and identify genes from specific cell types, enabling the systematic study of genes involved in diseases.

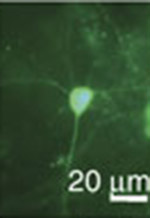
The team used the new method to successfully identify genes expressed in cells known as podocytes — the “work-horses” of the kidney — that malfunction in kidney disease. The investigators showed that certain patterns of activity of these genes were correlated with the severity of kidney impairment in patients, and that the computer-based approach was significantly more accurate than existing experimental methods in mice at identifying cell-lineage-specific genes. The study was published in the journal Genome Research.

Using this technique, researchers can now examine the genes from a section of whole tissue, such as a biopsied section of the kidney, for specific signatures associated with certain cell types. By evaluating patterns of gene expression under different conditions in these cells, a computer can use machine-learning techniques to deduce which types of cells are present. The system can then identify which genes are expressed in the cell type in which they are interested.  This information is critical both in defining novel disease biomarkers and in selecting potential new drug targets.

By applying the new method to kidney biopsy samples, the researchers identified at least 136 genes as expressed specifically in podocytes. Two of these genes were experimentally shown to be able to cause kidney disease. The authors also demonstrated that in silico nano-dissection can be used for cells other than those found in the kidney, suggesting that the method is useful for the study of a range of diseases.

The computational method was significantly more accurate than another commonly used technique that involves isolating specific cell types in mice. The nano-dissection method’s accuracy was 65% versus 23% for the mouse method, as evaluated by a time-consuming process known as immunohistochemistry which involves staining each gene of interest to study its expression pattern.

The research was co-led by Olga Troyanskaya, a professor of computer science and the Lewis-Sigler Institute for Integrative Genomics at Princeton, and Matthias Kretzler, a professor of computational medicine and biology at the University of Michigan. The first authors on the study were Wenjun Ju, a research assistant professor at the University of Michigan, and Casey Greene, now at the Geisel School of Medicine at Dartmouth and a former postdoctoral fellow at Princeton.

The research was supported in part by National Institutes of Health (NIH) R01 grant GM071966 to OGT and MK, by NIH grants RO1 HG005998 and DBI0546275 to OGT, by NIH center grant P50 GM071508, and by NIH R01 grant DK079912 and P30 DK081943 to MK. OGT also receives support from the Canadian Institute for Advanced Research.

Read the abstract.

Wenjun Ju, Casey S Greene, Felix Eichinger, Viji Nair, Jeffery B Hodgin, Markus Bitzer, Young-suk Lee, Qian Zhu, Masami Kehata, Min Li, Song Jiang, Maria Pia Rastaldi, Clemens D Cohen, Olga G Troyanskaya and Matthias Kretzler. 2013. Defining cell-type specificity at the transcriptional level in human disease. Genome Research. Published in Advance August 15, 2013, doi: 10.1101/gr.155697.113.

New mouse model for hepatitis C (Nature)

By Catherine Zandonella, Office of the Dean for Research

Hepatitis C affects about three million people in the U.S. and is a leading cause of chronic liver disease, so creating a vaccine and new treatments is an important public health goal. Most research to date has been done in chimpanzees because they are one of a handful of species that become infected and spread the virus.

Now researchers led by Alexander Ploss of Princeton University and Charles Rice of the Rockefeller University have generated a mouse that can become infected with hepatitis C virus (HCV).  They reported the advance in the Sept 12 issue of the journal Nature. “The entire life cycle of the virus — from infection of liver cells to viral replication, assembly of new particles, and release from the infected cell — occurs in these mice,” said Ploss, who joined the Princeton faculty in July 2013 as assistant professor of molecular biology.

Ploss and his colleagues have been working for some time on the challenge of creating a small animal model for studying the disease. Four years ago, while at the Rockefeller University in New York, Ploss and Rice identified two human proteins, known as CD81 and occludin, that enable mouse cells to become infected with HCV (Nature 2009). In a follow up study Ploss and colleagues showed that a mouse engineered to express these human proteins could become infected with HCV, although the animals could not spread the virus (Nature 2011).

In the present study, which included colleagues at Osaka University and the Scripps Research Institute, the researchers bred the human-protein-containing mice with another strain that had a defective immune system – one that could not easily rid the body of viruses. The resulting mice not only become infected, but could potentially pass the virus to other susceptible mice.

The availability of this new way to study HCV could help researchers discover new vaccines and treatments, although Ploss cautioned that more work needs to be done to refine the model.

The study was supported in part by award number RC1DK087193 from the National Institute of Diabetes and Digestive and Kidney Diseases; R01AI072613, R01AI099284, and R01AI079031 from the National Institute for Allergy and Infectious Disease; R01CA057973 from the National Cancer Institute; and several foundations and contributors, as well as the Infectious Disease Society of America and the American Liver Foundation.

Read the abstract

Marcus Dorner, Joshua A. Horwitz, Bridget M. Donovan, Rachael N. Labitt, William C. Budell, Tamar Friling, Alexander Vogt, Maria Teresa Catanese, Takashi Satoh, Taro Kawai, Shizuo Akira, Mansun Law, Charles Rice & Alexander Ploss. 2013. Completion of the entire hepatitis C virus life cycle in genetically humanized mice. Nature 501, 237–241 (First published online on 31 July 2013)  doi:10.1038/nature12427.


Shingles symptoms may be caused by neuronal short circuit (Proceedings of the National Academy of Sciences)

By Catherine Zandonella, Office of the Dean for Research

Neurons firing in synchrony could be responsible for pain, itch in shingles and herpes infection. Click to view movie. (Source: PNAS)

The pain and itching associated with shingles and herpes may be due to the virus causing a “short circuit” in the nerve cells that reach the skin, Princeton researchers have found.

This short circuit appears to cause repetitive, synchronized firing of nerve cells, the researchers reported in the journal Proceedings of the National Academy of Sciences. This cyclical firing may be the cause of the persistent itching and pain that are symptoms of oral and genital herpes as well as shingles and chicken pox, according to the researchers.

These diseases are all caused by viruses of the herpes family. Understanding how these viruses cause discomfort could lead to better strategies for treating symptoms.

The team studied what happens when a herpes virus infects neurons. For research purposes the investigators used a member of the herpes family called pseudorabies virus. Previous research indicated that these viruses can drill tiny holes in neurons, which pass messages in the form of electrical signals along long conduits known as axons.

The researchers’ findings indicate that electrical current can leak through these holes, or fusion pores, and spread to nearby neurons that were similarly damaged, causing the neurons to fire all at once rather than as needed. The pores were likely created for the purpose of infecting new cells, the researchers said.

Researchers at Princeton University imaged the synchronized, repetitive firing of herpes-infected neurons in a region known as the submandibular ganglia (SMG) between the salivary glands and the brain in mice. Image source: PNAS.
Researchers at Princeton University imaged the synchronized, repetitive firing of herpes-infected neurons in a region known as the submandibular ganglia (SMG) between the salivary glands and the brain in mice. (Source: PNAS)

The investigators observed the cyclical firing of neurons in a region called the submandibular ganglia between the salivary glands and the brain in mice using a technique called 2-photon microscopy and dyes that flash brightly when neurons fire. (Movie of synchronized firing of herpes-infected neurons.)

The team found that two viral proteins appear to work together to cause the simultaneous firing, according to Andréa Granstedt, who received her Ph.D. in molecular biology at Princeton in 2013 and is the first author on the article.  The team was led by Lynn Enquist, Princeton’s Henry L. Hillman Professor in Molecular Biology and a member of the Princeton Neuroscience Institute.

Each colored line and number on the right represents an individual neuron. The overlapping peaks indicate synchronized firing of neurons, which occurs when electrical current is able to leak from one neuron to the next. (Source: PNAS)

The first of these two proteins is called glycoprotein B, a fusion protein that drills the holes in the axon wall. A second protein, called Us9, acts as a shuttle that sends glycoprotein B into axons, according to the researchers. “The localization of glycoprotein B is crucial,” Granstedt said. “If glycoprotein B is present but not in the axons, the synchronized flashing won’t happen.”

The researchers succeeded in stopping the short circuit from occurring in engineered viruses that lacked the gene for either glycoprotein B or Us9. Such genetically altered viruses are important as research tools, Enquist said.

Finding a way to block the activity of the proteins could be a useful strategy for treating the pain and itching associated with herpes viral diseases, Enquist said. “If you could block fusion pore formation, you could stop the generation of the signal that is causing pain and discomfort,” he said.

Granstedt conducted the experiments with Jens-Bernhard Bosse, a postdoctoral research associate in molecular biology. Assistance with 2-photon microscopy was provided by Stephan Thiberge, director of the Bezos Center for Neural Circuit Dynamics at the Princeton Neuroscience Institute.

The team previously observed the synchronized firing in laboratory-grown neurons (PLoS Pathogens, 2009), but the new study expands on the previous work by observing the process in live mice and including the contribution of Us9, Granstedt said.

Shingles, which is caused by the virus herpes zoster and results in a painful rash, will afflict almost one out of three people in the United States over their lifetime. Genital herpes, which is caused by herpes simplex virus-2, affects about one out of six people ages 14 to 49 years in the United States, according the Centers for Disease Control and Prevention.

This research was funded by National Institutes of Health (NIH) Grants NS033506 and NS060699. The Imaging Core Facility at the Lewis-Sigler Institute is funded by NIH National Institute of General Medical Sciences Center Grant PM50 GM071508.

Read the abstract

Granstedt, Andréa E., Jens B. Bosse, Stephan Y. Thiberge, and Lynn W. Enquist. 2013. In vivo imaging of alphaherpesvirus infection reveals synchronized activity dependent on axonal sorting of viral proteins. PNAS 2013 ; published ahead of print August 26, 2013, doi:10.1073/pnas.1311062110

Princeton researchers use mobile phones to measure happiness (Demography)

By Tara Thean, Science-Writing Intern, Office of the Dean for Research

World map
Locations of study subjects on world map (Source: Demography)

Researchers at Princeton University are developing ways to use mobile phones to explore how one’s environment influences one’s sense of well-being.

In a study involving volunteers who agreed to provide information about their feelings and locations, the researchers found that cell phones can efficiently capture information that is otherwise difficult to record, given today’s on-the-go lifestyle. This is important, according to the researchers, because feelings recorded “in the moment” are likely to be more accurate than feelings jotted down after the fact.

To conduct the study, the team created an application for the Android operating system that documented each person’s location and periodically sent the question, “How happy are you?”

The investigators invited people to download the app, and over a three-week period, collected information from 270 volunteers in 13 countries who were asked to rate their happiness on a scale of 0 to 5. From the information collected, the researchers created and fine-tuned methods that could lead to a better understanding of how our environments influence emotional well-being. The study was published in the June issue of Demography.

The mobile phone method could help overcome some of the limitations that come with surveys conducted at people’s homes, according to the researchers. Census measurements tie people to specific areas — the census tracts in which they live — that are usually not the only areas that people actually frequent.

“People spend a significant amount of time outside their census tracks,” said John Palmer, a graduate student in the Woodrow Wilson School of Public and International Affairs and the paper’s lead author. “If we want to get more precise findings of contextual measurements we need to use techniques like this.”

Palmer teamed up with Thomas Espenshade, professor of sociology emeritus, and Frederic Bartumeus, a specialist in movement ecology at the Center for Advanced Studies of Blanes in Spain, along with Princeton’s Chang Chung, a statistical programmer and data archivist in the Office of Population Research; Necati Ozgencil, a former Professional Specialist at Princeton; and Kathleen Li, who earned her undergraduate degree in computer science from Princeton in 2010, to design the free, open source application for the Android platform that would record participants’ locations at various intervals based on either GPS satellites or cellular tower signals.

Though many of the volunteers lived in the United States, some were in Australia, Canada, China, France, Germany, Israel, Japan, Norway, South Korea, Spain, Sweden and the United Kingdom.

Palmer noted that the team’s focus at this stage was not on generalizable conclusions about the link between environment and happiness, but rather on learning more about the mobile phone’s capabilities for data collection. “I’d be hesitant to try to extend our substantive findings beyond those people who volunteered.” he said.

However, the team did obtain some preliminary results regarding happiness: for example, male subjects tended to describe themselves as less happy when they were further from their homes, whereas females did not demonstrate a particular trend with regards to emotions and distance.

“One of the limitations of the study is that it is not representative of all people,” Palmer said. Participants had to have smartphones and be Internet users. It is also possible that people who were happy were more likely to respond to the survey. However, Palmer said, the study demonstrates the potential for mobile phone research to reach groups of people that may be less accessible by paper surveys or interviews.

Palmer’s doctoral dissertation will expand on this research, and his adviser Marta Tienda, the Maurice P. During Professor in Demographic Studies, said she was excited to see how it will impact the academic community. “His applied research promises to redefine how social scientists understand intergroup relations on many levels,” she said.

This study involved contributions from the Center for Information Technology Policy at Princeton University, with institutional support from the National Institutes of Health Training Grant T32HD07163 and Infrastructure Grant R24HD047879.

Read the abstract.

Palmer, John R. B., Thomas J. Espenshade, Frederic Bartumeus, Chang Y. Chung, Necati Ercan Ozgencil and Kathleen Li. 2013. New Approaches to Human Mobility: Using Mobile Phones for Demographic Research. Demography 50:1105–1128. DOI 10.1007/s13524-012-0175-z

How will crops fare under climate change? Depends on how you ask (Global Change Biology)

Research image
Mechanistic (top row) and empirical (bottom row) simulations compared recent, or “baseline,” maize production in South Africa (1979-99) to projected future production under climate change (2046-65). While both models showed a reduction in output, the third column shows that the empirical model estimated a widespread yield loss of around 10 percent (in yellow), while the mechanistic model showed several areas of increased production (in green). (Image by Lyndon Estes)
Research image 2
For wheat, the mechanistic model (top row) projected greater wheat yields, while the empirical model (bottom row) suggested that wheat-growing areas would expand by almost 50 percent. (Image by Lyndon Estes)

By Morgan Kelly, Office of Communications

The damage scientists expect climate change to do to crop yields can differ greatly depending on which type of model was used to make those projections, according to research based at Princeton University. The problem is that the most dire scenarios can loom large in the minds of the public and policymakers, yet neither audience is usually aware of how the model itself influenced the outcome, the researchers said.

The report in the journal Global Change Biology is one of the first to compare the agricultural projections generated by empirical models — which rely largely on field observations — to those by mechanistic models, which draw on an understanding of how crop growth and development are affected by the environment. Building on similar studies from ecology, the researchers found yet more evidence that empirical models may show greater losses as a result of climate change, while mechanistic models may be overly optimistic.

The researchers ran an empirical and a mechanistic model to see how maize and wheat crops in South Africa — the world’s ninth largest maize producer, and sub-Saharan Africa’s second largest source of wheat — would fare under climate change in the years 2046 to 2065. Under the hotter, wetter conditions projected by the climate scenarios they used, the empirical model estimated that maize production could drop by 3.6 percent, while wheat output could increase by 6.2 percent. Meanwhile, the mechanistic model calculated that maize and wheat yields might go up by 6.5 and 15.2 percent, respectively.

In addition, the empirical model estimated that suitable land for growing wheat would drop by 10 percent, while the mechanistic model found that it would expand by 9 percent. The empirical model projected a 48 percent expansion in wheat-growing areas, but the mechanistic reported only 20 percent growth. In regions where the two models overlapped, the empirical model showed declining yields while the mechanistic model showed increases. These wheat models were less accurate, but still indicative of the vastly different estimates empirical and mechanistic can produce, the researchers wrote.

Disparities such as these aren’t just a concern for climate-change researchers, said first author Lyndon Estes, an associate research scholar in the Program in Science, Technology and Environmental Policy in Princeton’s Woodrow Wilson School of Public and International Affairs. Impact projections are crucial as people and governments work to understand and address climate change, but it also is important that people understand how they are generated and the biases inherent in them, Estes said. The researchers cite previous studies that suggest climate change will reduce South African maize and wheat yields by 28 to 30 percent — according to empirical studies. Mechanistic models project a more modest 10 to 19 percent loss. What’s a farmer or government minister to believe?

“A yield projection based only on empirical models is likely to show larger yield losses than one made only with mechanistic models. Neither should be considered more right or wrong, but people should be aware of these differences,” Estes said. “People who are interested in climate-change science should be aware of all the sources of uncertainty inherent in projections, and should be aware that scenarios based on a single model — or single class of models — are not accounting for one of the major sources of uncertainty.”

The researchers’ work relates to a broader effort in recent years to examine the biases introduced into climate estimates by the models and data scientists use, Estes said. For instance, a paper posted Aug. 7 by Global Change Biology — and includes second author and 2011 Princeton graduate Ryan Huynh — challenges predictions that higher global temperatures will result in the widespread extinction of cold-blooded forest creatures, particularly lizards. These researchers say that a finer temperature scale than existing projections use suggests that many cold-blooded species would indeed thrive on a hotter Earth.

Scientists are aware of the differences between empirical and mechanistic models, said Estes, who was prompted by a similar comparison that showed an empirical-mechanistic divergence in tree-growth models. Yet, only one empirical-to-mechanistic comparison (of which Estes also was first author) has been published in relation to agriculture — and it didn’t even examine the impact of climate change.

The solution would be to use both model classes so that researchers could identify each class’s biases and correct for it, Estes said. Each model has different strengths and weaknesses that can be complementary when combined.

Simply put, empirical models are built by finding the relationship between observed crop yields and historical environmental conditions, while mechanistic models are built on the physiological understanding of how the plant grows and reproduces in response to a range of conditions. Empirical models, which are simpler and require fewer inputs, are a staple in studying the possible effects of climate change on ecological systems, where the data and knowledge about most species is largely unavailable. Mechanistic models are more common in studying agriculture because there is a much greater wealth of data and knowledge that has accumulated over several thousand years of agricultural development, Estes said.

“These two model classes characterize different portions of the environmental space, or niche, that crops and other species occupy,” Estes said. “Using them together gives us a better sense of the range of uncertainty in the projections and where the errors and limitations are in the data and models. Because the two model classes have such different structures and assumptions, they also can improve our confidence in scenarios where their findings agree.”

Read the abstract.

Estes, Lyndon D., Hein Beukes, Bethany A. Bradley, Stephanie R. Debats, Michael Oppenheimer, Alex C. Ruane, Roland Schulze and Mark Tadross. 2013. Projected climate impacts to South African maize and wheat production in 2055: A comparison of empirical and mechanistic modeling approaches. Global Change Biology. Accepted, unedited article first published online: July 17, 2013. DOI: 10.1111/gcb.12325

The work was funded by the Princeton Environmental Institute‘s Grand Challenges Program.

A faster vessel for charting the brain (Nature Communications)

Mouse neuron
Mouse neuron expressing GCaMP3. (Image source: Nature.)

By Morgan Kelly, Office of Communications

Princeton University researchers have created “souped up” versions of the calcium-sensitive proteins that for the past decade or so have given scientists an unparalleled view and understanding of brain-cell communication.

Reported July 18 in the journal Nature Communications, the enhanced proteins developed at Princeton respond more quickly to changes in neuron activity, and can be customized to react to different, faster rates of neuron activity. Together, these characteristics would give scientists a more precise and comprehensive view of neuron activity.

The researchers sought to improve the function of proteins known as green fluorescent protein/calmodulin protein (GCaMP) sensors, an amalgam of various natural proteins that are a popular form of sensor proteins known as genetically encoded calcium indicators, or GECIs. Once introduced into the brain via the bloodstream, GCaMPs react to the various calcium ions involved in cell activity by glowing fluorescent green. Scientists use this fluorescence to trace the path of neural signals throughout the brain as they happen.

GCaMPs and other GECIs have been invaluable to neuroscience, said corresponding author Samuel Wang, a Princeton associate professor of molecular biology and the Princeton Neuroscience Institute. Scientists have used the sensors to observe brain signals in real time, and to delve into previously obscure neural networks such as those in the cerebellum. GECIs are necessary for the BRAIN Initiative President Barack Obama announced in April, Wang said. The estimated $3 billion project to map the activity of every neuron in the human brain cannot be done with traditional methods, such as probes that attach to the surface of the brain. “There is no possible way to complete that project with electrodes, so you have to do it with other tools — GECIs are those tools,” he said.

Despite their value, however, the proteins are still limited when it comes to keeping up with the fast-paced, high-voltage ways of brain cells, and various research groups have attempted to address these limitations over the years, Wang said.

“GCaMPs have made significant contributions to neuroscience so far, but there have been some limits and researchers are running up against those limits,” Wang said.

One shortcoming is that GCaMPs are about one-tenth of a second slower than neurons, which can fire hundreds of times per second, Wang said. The proteins activate after neural signals begin, and mark the end of a signal when brain cells have (by neuronal terms) long since moved on to something else, Wang said. A second current limitation is that GCaMPs can only bind to four calcium ions at a time. Higher rates of cell activity cannot be fully explored because GCaMPs fill up quickly on the accompanying rush of calcium.

The Princeton GCaMPs respond more quickly to changes in calcium so that changes in neural activity are seen more immediately, Wang said. By making the sensors a bit more sensitive and fragile — the proteins bond more quickly with calcium and come apart more readily to stop glowing when calcium is removed — the researchers whittled down the roughly 20 millisecond response time of existing GCaMPs to about 10 milliseconds, Wang said.

The researchers also tweaked certain GCaMPs to be sensitive to different types of calcium ion concentrations, meaning that high rates of neural activity can be better explored. “Each probe is sensitive to one range or another, but when we put them together they make a nice choir,” Wang said.

The researchers’ work also revealed the location of a “bottleneck” in GCaMPs that occurs when calcium concentration is high, which poses a third limitation of the existing sensors, Wang said. “Now that we know where that bottle neck is, we think we can design the next generation of proteins to get around it,” Wang said. “We think if we open up that bottleneck, we can get a probe that responds to neuronal signals in one millisecond.”

The faster protein that the Princeton researchers developed could pair with work in other laboratories to improve other areas of GCaMP function, Wang said. For instance, a research group out of the Howard Hughes Medical Institute reported in Nature July 17 that it developed a GCaMP with a brighter fluorescence. Such improvements on existing sensors gradually open up more of the brain to exploration and understanding, said Wang, adding that the Princeton researchers will soon introduce their sensor into fly and mammalian brains.

“At some level, what we’ve done is like taking apart an engine, lubing up the parts and putting it back together. We took what was the best version of the protein at the time and made changes to the letter code of the protein,” Wang said. “We want to watch the whole symphony of thousands of neurons do their thing, and we think this variant of GCaMPs will help us do that better than anyone else has.”

Read the abstract.

Sun, Xiaonan R., Aleksandra Badura, Diego A. Pacheco, Laura A. Lynch, Eve R. Schneider, Matthew P. Taylor, Ian B. Hogue, Lynn W. Enquist, Mala Murthy and Samuel S.-H. Wang. 2013. Fast GCaMPs for improved tracking of neuronal activity. Nature Communications. Article first published online: July 18, 2013. DOI: 10.1038/ncomms3170

This work was supported by NIH R01 NS045193, (S.S.-H.W.) RC1 NS068414 (L.W.E./S.S.-H.W.), and P40 RR18604 and NS060699 (L.W.E.), a McKnight Technological Innovations Award (S.S.-H.W.), a W.M. Keck Foundation Distinguished Young Investigator award (S.S.-H.W.), an Alfred P. Sloan Research Fellowship, Klingenstein, McKnight, and NSF CAREER Young Investigator awards (M.M.), and an American Cancer Society Postdoctoral Research Fellowship (M.P.T./I.B.H.).

Pupil study reveals learning styles, brain activity (Nature Neuroscience)

Test of learning styles experiment
To test people’s learning styles, participants were presented with a choice between two images (objects or words) and rewarded according to their choices. In this exercise, to maximize reward, participants had to learn by trial and error that office-related images provide a higher reward than food-related images (semantic, or related to meaning), and that grayscale images provide a higher reward than color images (visual features). Image credit: Nature Neuroscience.

By Catherine Zandonella, Office of the Dean for Research

People are often said to have “learning styles” – for example, some people pay attention to visual details while others grab onto abstract concepts and meanings. A new study from Princeton University researchers found that changes in pupil size can reveal whether people are learning using their dominant learning style, or whether they are learning in modes outside of that style.

The researchers found that pupil dilation was smaller when people learned using their usual style and larger when people diverged from their normal style. The study was published in the journal Nature Neuroscience.

The study compared brain activity in individuals with two different learning styles – those who learn best by absorbing concrete visual details and those who are better at learning abstract concepts or meanings.

“We showed that changes in pupil dilation are associated with the degree to which learners use the style for which they have a predisposition,” said Eldar Eran, a graduate student in the Princeton Neuroscience Institute, who led the study.

The researchers used changes in pupil size as an indicator of variations in “neural gain,” which can be thought of as an amplifier of neural communication: when gain is increased, excited neurons become even more active and inhibited neurons become even less active. Smaller pupil dilation indicates more neural gain and larger pupil dilation indicates less neural gain.

The team showed that neural gain was correlated with different modes of communication between parts of the brain. In studies of human volunteers undergoing brain scans, when neural gain was high, communication tended to be tightly concentrated in certain regions of the brain that govern specific tasks, whereas low neural gain is associated with communication across wider regions of the brain.

“We showed that the brain has different modes of communication,” said Yael Niv, assistant professor of psychology and the Princeton Neuroscience Institute, “one mode where everything talks to everything else, and another mode where communication is more segregated into areas that don’t talk to each other.” The study also involved Jonathan Cohen, Princeton’s Robert Bendheim and Lynn Bendheim Thoman Professor in Neuroscience.

These modes are linked to the level of neural gain and to learning style, Niv said. Neural gain can be thought of as a contrast amplifier that increases intensity of both activation and inhibition of communication among brain areas. “If one area is trying to activate another, or trying to inhibit another – both effects are stronger, everything is more potent,” she said. “This is correlated with communication being segregated into clusters of activation in the brain, so each network is talking to itself loudly, but connections across networks are inhibited. In situations of lower gain, however, the areas can talk to each other across networks, so information flows more globally.”

“These two modes [of communication in the brain] seem to be associated with different constraints on learning,” she said. “According to our study, in the mode where everything talks to everything, learning is very flexible. In contrast, in the mode where communication is stronger and more focused, but also more segregated between brain areas, subjects were more true to their personal learning style. Neither of these modes are better than the other – in both cases participants were equally successful in the task, but in different ways.”

“We interpreted these results to mean that although we tend to have a dominant learning style, we are not a slave to that style, and when operating in the proper mode, we can overcome dominant styles to learn in other ways,” she said.

This research was funded by NIH grants R03 DA029073 and R01 MH098861, a Howard Hughes Medical Institute International Student Research fellowship, and a Sloan Research Fellowship. The authors also wish to thank the generous support of the Regina and John Scully Center for the Neuroscience of Mind and Behavior within the Princeton Neuroscience Institute.

Read the article

Eldar, Eran, Jonathan D Cohen & Yael Niv. 2013. The effects of neural gain on attention and learning.  Nature Neuroscience. Published online June 16, 2013 doi:10.1038/nn.3428

New imaging technique provides improved insight into controlling the plasma in fusion experiments (Plasma Physics and Controlled Fusion)

Graphic of fluctuating electron temperatures
Graphic representation of 2D images of fluctuating electron temperatures in a cross-section of a confined fusion plasma. (Image source: Plasma Physics and Controlled Fusion)

By John Greenwald, Office of Communications, Princeton Plasma Physics Laboratory

A key issue for the development of fusion energy to generate electricity is the ability to confine the superhot, charged plasma gas that fuels fusion reactions in magnetic devices called tokamaks. This gas is subject to instabilities that cause it to leak from the magnetic fields and halt fusion reactions.

Now a recently developed imaging technique can help researchers improve their control of instabilities. The new technique, developed by physicists at the U.S. Department of Energy’s Princeton Plasma Physics Laboratory (PPPL), the University of California-Davis and General Atomics in San Diego, provides new insight into how the instabilities respond to externally applied magnetic fields.

This technique, called Electron Cyclotron Emission Imaging (ECEI) and successfully tested on the DIII-D tokamak at General Atomics, uses an array of detectors to produce a 2D profile of fluctuating electron temperatures within the plasma. Standard methods for diagnosing plasma temperature have long relied on a single line of sight, providing only a 1D profile. Results of the ECEI technique, recently reported in the journal Plasma Physics and Controlled Fusion, could enable researchers to better model the response of confined plasma to external magnetic perturbations that are applied to improve plasma stability and fusion performance.

PPPL is managed by Princeton University.

Read the abstract.

B.J. Tobias; L.Yu; C.W. Domier; N.C. Luhmann, Jr; M.E. Austin; C. Paz-Soldan; A.D. Turnbull; I.G.J. Classen; and the DIII-D Team. 2013. Boundary perturbations coupled to core 3/2 tearing modes on the DIII-D tokamak. Plasma Physics and Controlled Fusion. Article first published online: July 5, 2013. DOI:10.1088/0741-3335/55/9/095006

This work was supported in part by the US Department of Energy under DE-AC02- 09CH11466, DE-FG02-99ER54531, DE-FG03-97ER54415, DE-AC05-00OR23100, DE- FC02-04ER54698, and DE-FG02-95ER54309.


Migrating animals add new depth to how the ocean “breathes” (Nature Geoscience)

By Morgan Kelly, Office of Communications

The oxygen content of the ocean may be subject to frequent ups and downs in a very literal sense — that is, in the form of the numerous sea creatures that dine near the surface at night then submerge into the safety of deeper, darker waters at daybreak.

Research begun at Princeton University and recently reported on in the journal Nature Geoscience found that animals ranging from plankton to small fish consume vast amounts of what little oxygen is available in the ocean’s aptly named “oxygen minimum zone” daily. The sheer number of organisms that seek refuge in water roughly 200- to 650-meters deep (650 to 2,000 feet) every day result in the global consumption of between 10 and 40 percent of the oxygen available at these depths.

The findings reveal a crucial and underappreciated role that animals have in ocean chemistry on a global scale, explained first author Daniele Bianchi, a postdoctoral researcher at McGill University who began the project as a doctoral student of atmospheric and oceanic sciences at Princeton.

Migration depth of sea animals
Research begun at Princeton University found that the numerous small sea animals that migrate from the surface to deeper water every day consume vast amounts of what little oxygen is available in the ocean’s aptly named “oxygen minimum zone” daily. The findings reveal a crucial and underappreciated role that animals have in ocean chemistry on a global scale. The figure above shows the various depths (in meters) that animals migrate to during the day to escape predators. Red indicates the shallowest depths of 200 meters (650 feet), and blue represents the deepest of 600 meters (2,000 feet). The black numbers on the map represent the difference (in moles, used to measure chemical content) between the oxygen at the surface and at around 500 meters deep, which is the best parameter for predicting migration depth. (Courtesy of Daniele Bianchi)

“In a sense, this research should change how we think of the ocean’s metabolism,” Bianchi said. “Scientists know that there is this massive migration, but no one has really tried to estimate how it impacts the chemistry of the ocean.

“Generally, scientists have thought that microbes and bacteria primarily consume oxygen in the deeper ocean,” Bianchi said. “What we’re saying here is that animals that migrate during the day are a big source of oxygen depletion. We provide the first global data set to say that.”

Much of the deep ocean can replenish (often just barely) the oxygen consumed during these mass migrations, which are known as diel vertical migrations (DVMs).

But the balance between DVMs and the limited deep-water oxygen supply could be easily upset, Bianchi said — particularly by climate change, which is predicted to further decrease levels of oxygen in the ocean. That could mean these animals would not be able to descend as deep, putting them at the mercy of predators and inflicting their oxygen-sucking ways on a new ocean zone.

“If the ocean oxygen changes, then the depth of these migrations also will change. We can expect potential changes in the interactions between larger guys and little guys,” Bianchi said. “What complicates this story is that if these animals are responsible for a chunk of oxygen depletion in general, then a change in their habits might have a feedback in terms of oxygen levels in other parts of the deeper ocean.”

The researchers produced a global model of DVM depths and oxygen depletion by mining acoustic oceanic data collected by 389 American and British research cruises between 1990 and 2011. Using the background readings caused by the sound of animals as they ascended and descended, the researchers identified more than 4,000 DVM events.

They then chemically analyzed samples from DVM-event locations to create a model that could correlate DVM depth with oxygen depletion. With that data, the researchers concluded that DVMs indeed intensify the oxygen deficit within oxygen minimum zones.

“You can say that the whole ecosystem does this migration — chances are that if it swims, it does this kind of migration,” Bianchi said. “Before, scientists tended to ignore this big chunk of the ecosystem when thinking of ocean chemistry. We are saying that they are quite important and can’t be ignored.”

Bianchi conducted the data analysis and model development at McGill with assistant professor of earth and planetary sciences Eric Galbraith and McGill doctoral student David Carozza. Initial research of the acoustic data and development of the migration model was conducted at Princeton with K. Allison Smith (published as K.A.S. Mislan), a postdoctoral research associate in the Program in Atmospheric and Oceanic Sciences, and Charles Stock, a researcher with the Geophysical Fluid Dynamics Laboratory operated by the National Oceanic and Atmospheric Administration.

Read the abstract

Citation: Bianchi, Daniele, Eric D. Galbraith, David A. Carozza, K.A.S. Milan and Charles A. Stock. 2013. Intensification of open-oxygen minimum zones by vertically migrating animals. Nature Geoscience. Article first published online: June 9, 2013. DOI:10.1038/ngeo1837

This work was supported in part by grants from the Canadian Institute for Advanced Research and the Princeton Carbon Mitigation Initiative.


Pebbles and sand on Mars best evidence that a river ran through it (Science)

NASA Pebbles on Mars
Pebble-rich rock slabs have been observed on Mars, suggesting the presence of an ancient stream bed (Source: Science)

By Morgan Kelly, Office of Communications

Pebbles and sand scattered near an ancient Martian river network may present the most convincing evidence yet that the frigid deserts of the Red Planet were once a habitable environment traversed by flowing water.

Scientists with NASA’s Mars Science Laboratory mission reported May 30 in the journal Science the discovery of sand grains and small stones that bear the telltale roundness of river stones and are too heavy to have been moved by wind. The researchers estimated that the sediment was produced by water that moved at a speed between that of a small stream and a large river, and had a depth of roughly an inch to nearly 3 feet.

Co-author Kevin Lewis, a Princeton associate research scholar in geosciences and a participating scientist on the Mars mission, said that the rocks and sand are among the best evidence so far that water once flowed on Mars, and suggest that the planet’s past climate was wildly different from what it is today.

“This is one of the best pieces of evidence we’ve seen on the ground for flowing water,” Lewis said. “The shape of these rocks and sand is exactly the same kind of thing you’d see if you went out to any streambed. It suggests a very similar environment to the Earth’s.”

The researchers analyzed sediment taken from a Martian plain that abuts a sedimentary deposit known as an alluvial fan. Alluvial fans are comprised of sediment leftover when a river spreads out over a plain then dries up, and are common on Earth in arid regions such as Death Valley.

Yet Death Valley is a refreshing spring compared to Mars today, Lewis said. Satellite images taken in preparation for the 2012 landing of NASA’s Curiosity Mars rover had revealed ancient river channels carved into the land on and around Mount Sharp, a 3.5-mile high mound similar in size to Alaska’s Mt. McKinley that would become the rover’s landing site. A major objective of the Curiosity mission is to explore Mars’ past habitability.

Nonetheless, liquid water itself is most likely rare on Mars’ currently cold and dusty landscape where wind is the dominant force. Lewis was co-author on a paper in the May 2013 edition of the journal Geology that suggested that Mount Sharp, thought to be the remnant of a massive lake, is most likely a giant dust pile produced by Mars’ violent, swirling winds.

Strong as it might be, however, wind cannot move sediment grains with a diameter larger than a few millimeters, Lewis said. The sand and stones he and his colleagues analyzed had diameters ranging from one to 40 millimeters, or roughly the size of a mustard seed to being only slightly smaller than a golf ball. The roundness of the sediment also suggested a prolonged eroding force, Lewis said.

“Once you get above a couple of millimeters the wind will not be able to mobilize sediment. A number of the grains we see in this outcrop are substantially bigger than that,” Lewis said. “That really leaves us with fluvial transport as the most likely process. We knew Curiosity was landing near the fan, but to land right on top of these rocks that suggest the presence of water was really fortuitous.”

If the sediment does mean a river ran through Mars, the researchers must next determine when, where it came from and how it dried up, a project that will be a “major scientific project over the coming year,” Lewis said. The mystery also centers on the potential relationship of the river to the scars on Mount Sharp: Did the river flow down it? Was the mound a source of water after all?

“This evidence tells us that there were a diverse set of geological processes happening at roughly the same time within the proximity of [the landing site], and it gives us a picture of a much more dynamic Mars than we see today,” Lewis said. “Finding out how exactly they relate will be an exciting story.”

Read the abstract.

Citation: Williams, R.M.E., et al. 2013. Martian fluvial conglomerates at Gale Crater. Science. Article first published online: May. 30, 2013. DOI: 10.1126/science.1237317

This work was supported in part by grants from NASA Mars Program Office.